How to georeference images using QGIS 3
A guide on how to georeference a map, figure, or photo, based on locations with known coordinates, and how to extract vector shapefiles from them.
Fellow researchers and open-source GIS enthusiasts,
Welcome to my blog!
I’d like to start with a disclaimer – I may be a researcher of this very area but that doesn’t mean everything I do or write here will work for you, in your own desktop configurations and package versions. I have no responsibility if you lose data or mess up your installation. I also do not authorize any copies of my content.
Today, I am going to show you how to georeference an image using QGIS 3.18. Maybe you found this image in a paper, or maybe it is an aerial photograph. It doesn’t matter! If you know the coordinates of at least two non collinear points, you can add geolocation to the image!
To the steps:
Why isn’t this map already geolocated?
Sometimes you have access only to the final map and not to the vectors and rasters used to generate it. But, you need this map, figure or photo to be georeferenced, so you can compare it to something you have done, or so you can add a custom layer over this image.
An example
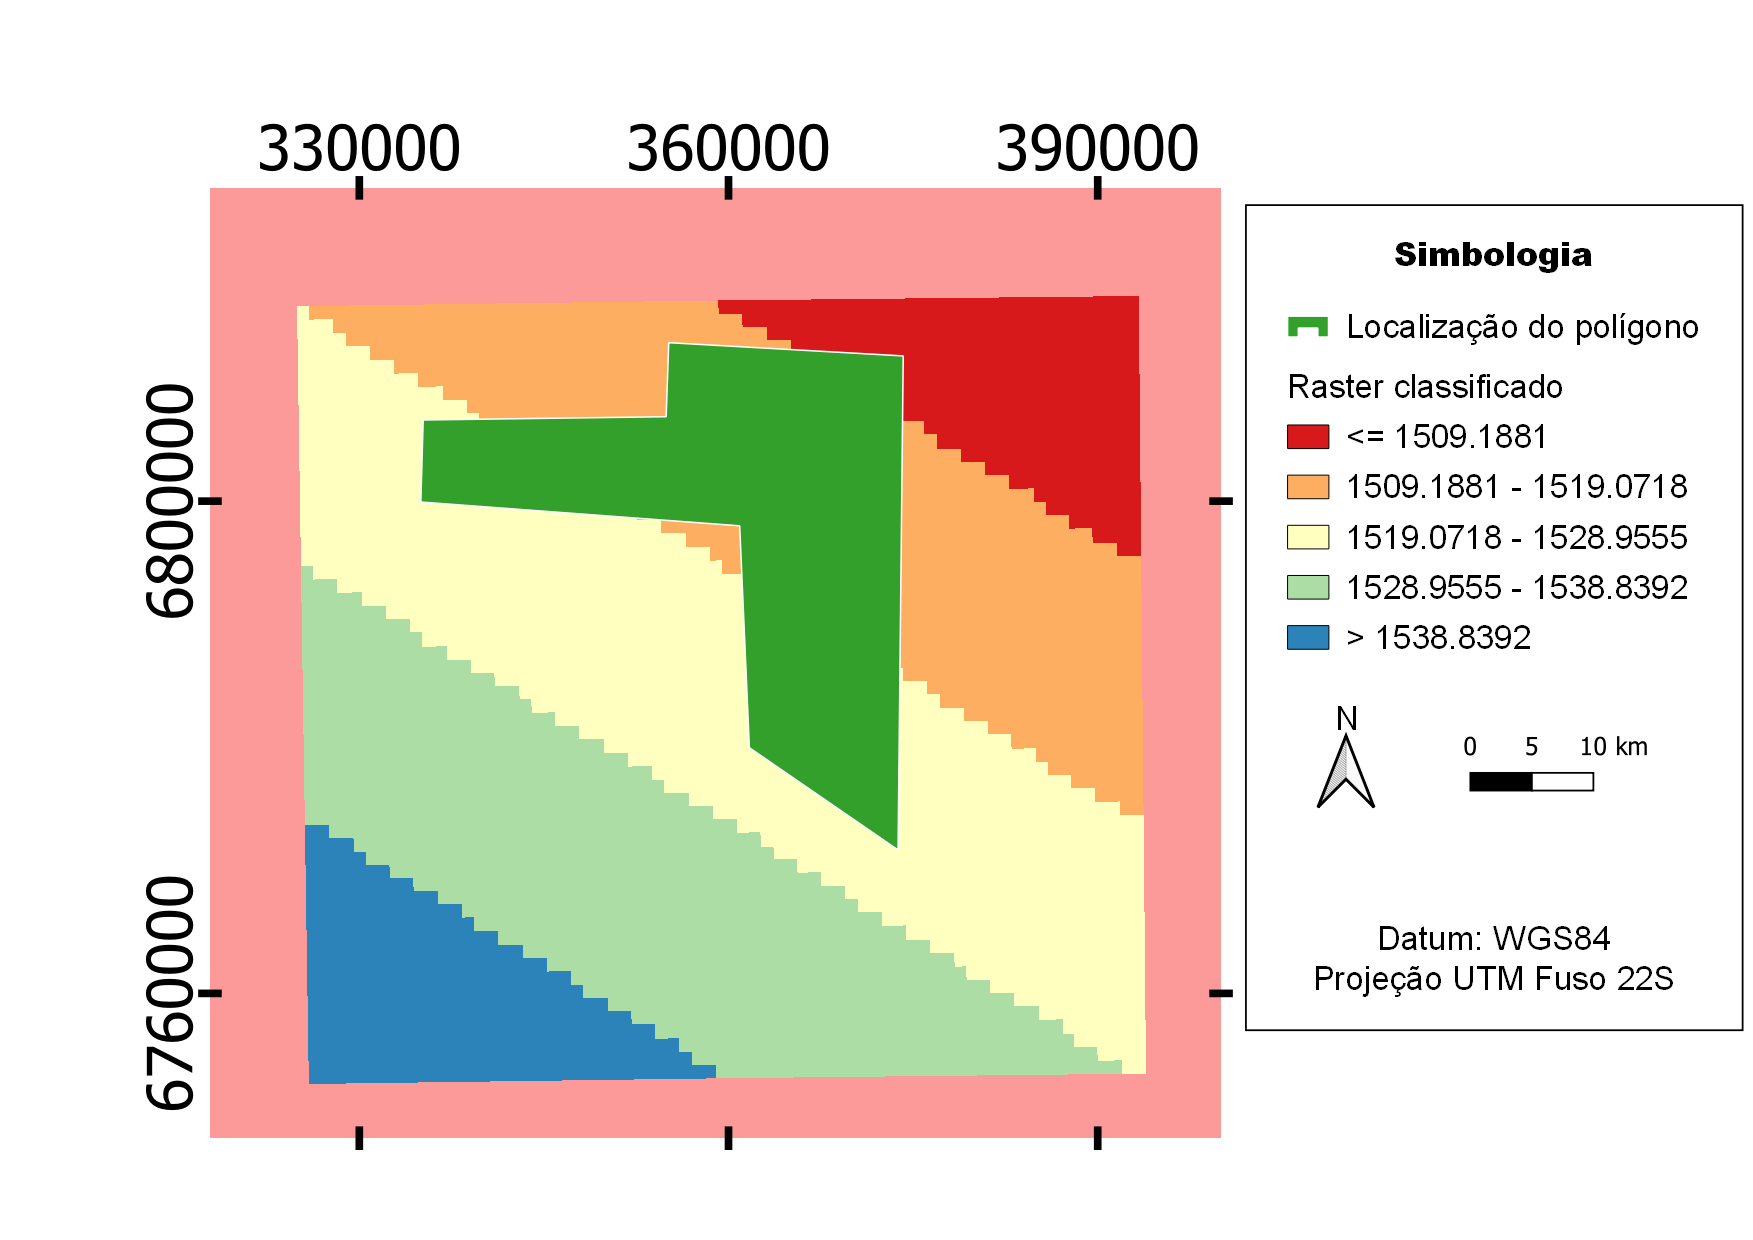
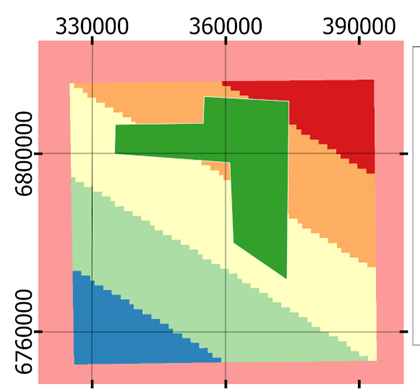
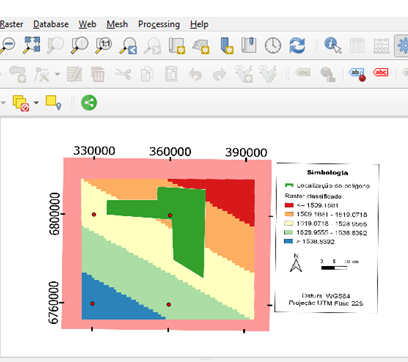
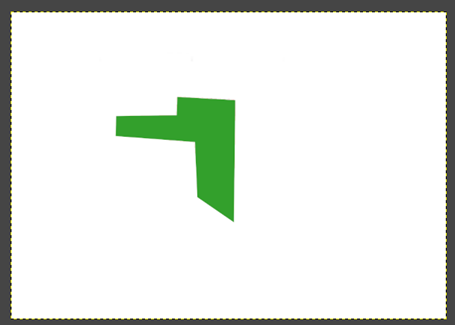
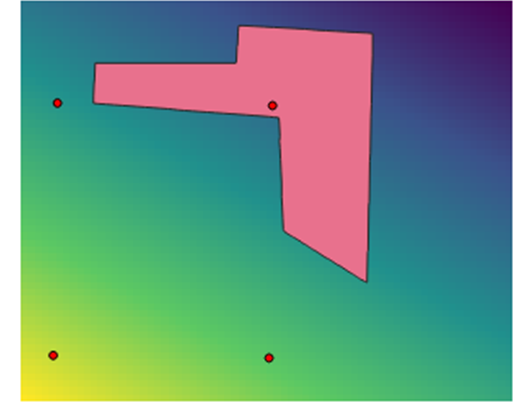
I am providing you this map as an example. It is a png image with no metadata and no geographical location information.
Imagine I saved this map from a journal article or paper and wish to geolocate the highlighted region, but the authors of the said paper did not provide the vector for this location.
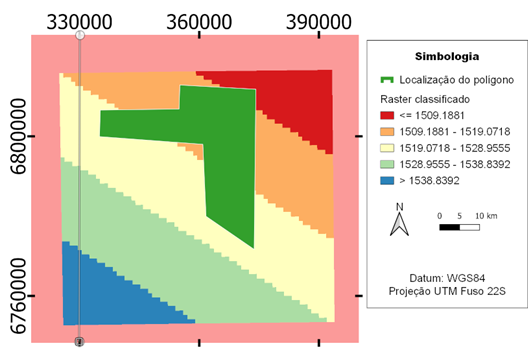
Actually, I just created this image, just so I could show you how to georeference it. I created a very “messy”, colorful map, that also includes a legend. I also chose to represent the coordinates in UTM, and only ticks instead of grids, which will be especially hard to georeference. I did this on purpose.
If you want to train performing the following procedure with a figure, you can download the following map at your will.
How to geolocate the map on QGIS
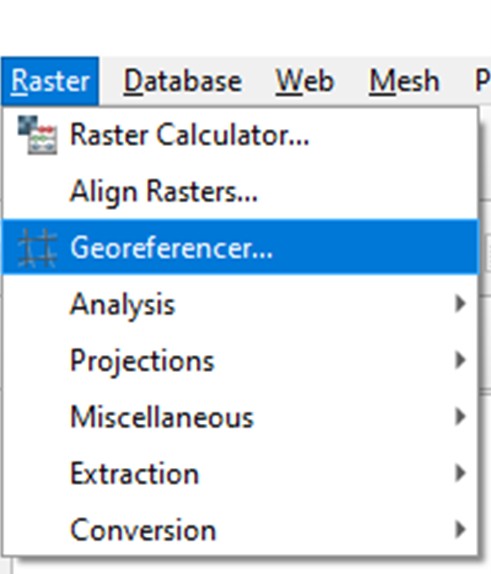
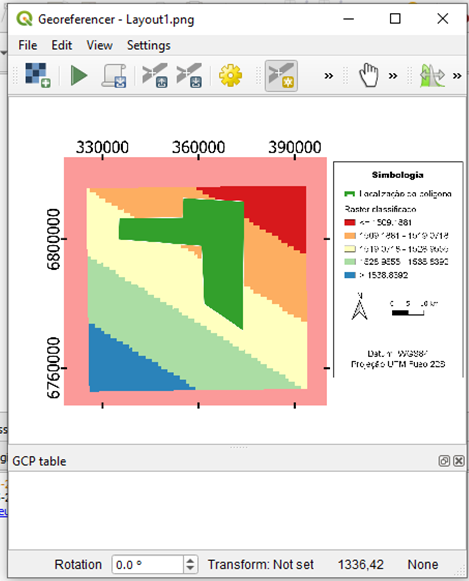
On QGIS, click on raster and then in Georeferencer
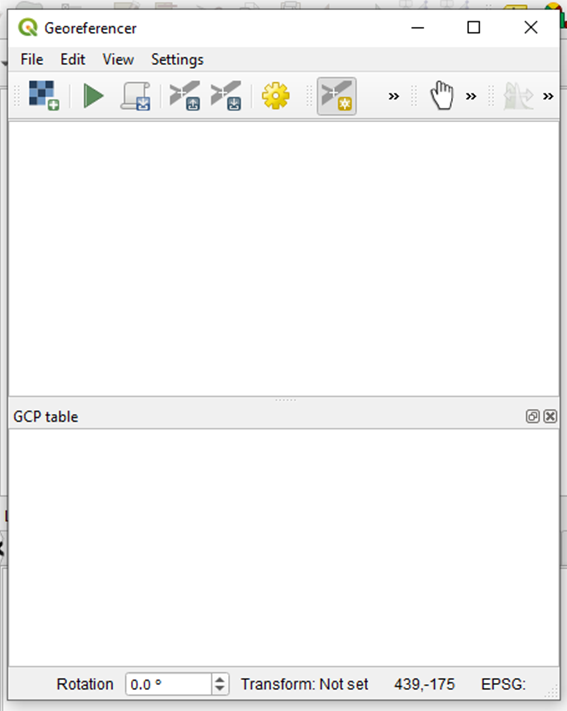
This window should open:
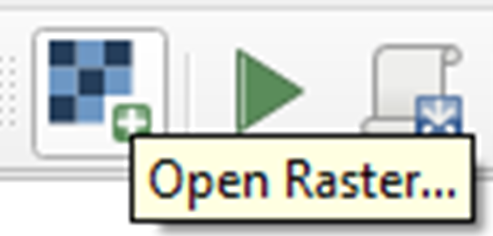
Click on Open Raster and open the image you want to geolocate.
Your cursor should look like a cross when you hover the image. If it doesn’t, you should click the button “Add Point”.
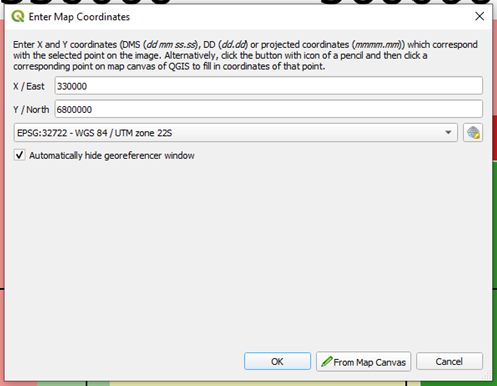
Then, you should click points in the image which you know the coordinates.
Unless there isn’t any…. You would generally choose places where the grids meet, intersections, because on these locations, you would know the exact coordinates.
However, because the grid was disabled, and only tick markers were kept, of course, this made the map look much cleaner, but it makes our georeferencing work much harder, unfortunately!
Add grids to the image (if there aren’t any)
If you can’t find the grids, draw them yourself.
Unfortunately, this has to be done outside QGIS.
First, make a copy of the image. This will be useful later.
Then, open the copy on your preferred image editor. Let’s choose GIMP, because it’s free software, which is the motive of this whole blog. But if you’re on Windows, you can use Paint for that. No problem.
I am using GIMP 2.10. My version is in Portuguese, so the names of the tools I cite here might have some variation in English.
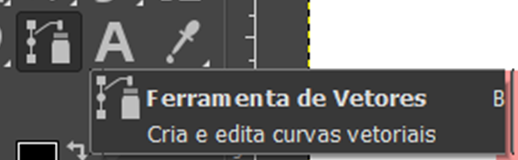
On GIMP, choose the vector tool.
Click once in the tick in the top and then click its analogous tick on the bottom.
Click on the third button, “Stroke vector”
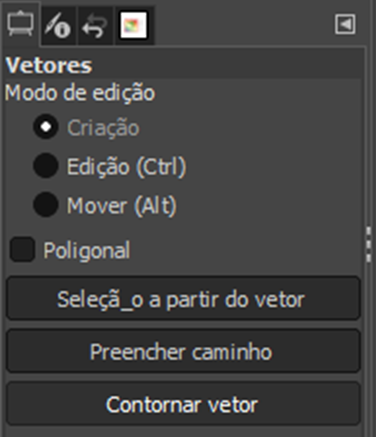
Then, click on “Stroke”
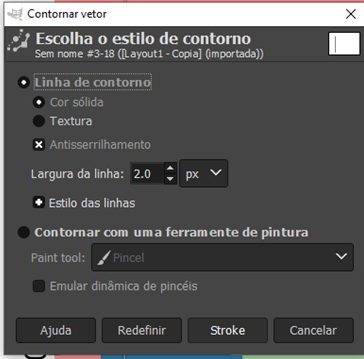
Click in any other tool to see the result and then click on the vector tool again.
Repeat this process for as many ticks as you like, at least two in each direction.
Save the file by overwriting it.
Select the points of the grid intersections and enter the coordinates
And… back to QGIS!
Open the edited figure on QGIS Georeferencer.
Zoom to the intersections between the drawn grids.
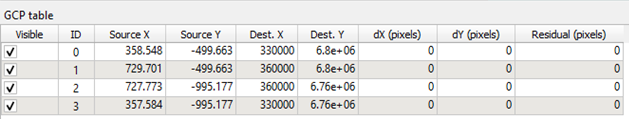
Click in “Add Points” and then the intersection of the grids to add the first point.
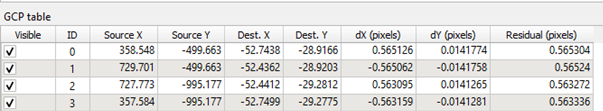
You should see a small red marker over your point, and your point is now listed in the table below.

Add the three other intersections visible. Now, your table should look like this:
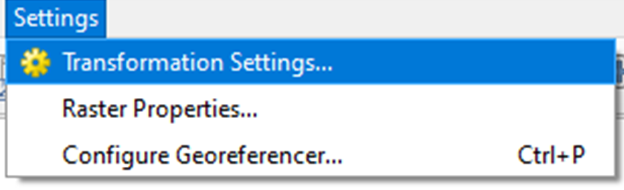
It’s time to configure the settings of your georeferencing. Click Settings, Transformation Settings
You should see a dialog like this one:
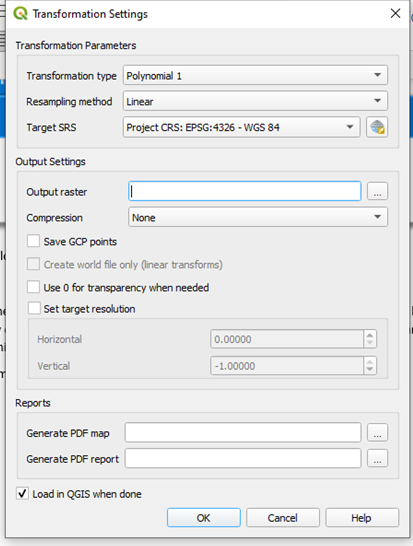
I chose the transformation type as Polynomial, and the resampling method as Linear, but there are many options to choose from. Pick your target SRS (it does not have to be the same as the one in which the points were provided). Fill the path to the output raster and make sure the option “Load in QGIS when done” is marked. Click OK.
Now, in the table, the Georeferencer should have filled the dX, dY and Residual columns. The Residuals should, ideally, be as small as possible. If they are large numbers, check if the marked points are well located, and try using a different transformation type on settings.
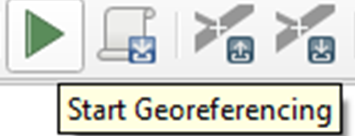
Click the button “Start Georeferencing”
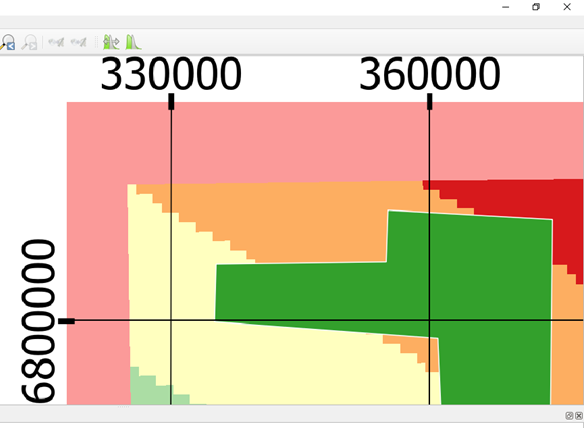
After it finishes, minimize the Georeferencer (don’t close it yet), and go to the main window of QGIS. The georeferenced image should be on the map. Check the location of the image in the map.
At this point, you are probably thinking that these lines I have drawn on GIMP can make the final map look messy, especially because I did not draw every grid line possible.
Is there any way of getting rid of these lines?
Yes, there is.
Save the points used for georeferencing and then use them on the original figure (optional)
Maximize the QGIS Georeferencer again.
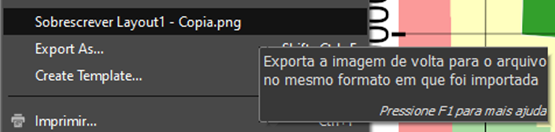
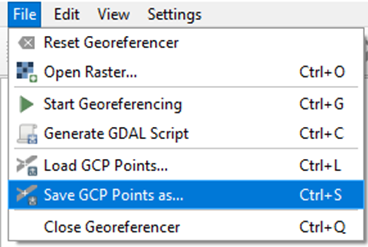
Go to “File, Save GCP Points as…”
And save those points.
Then, go to “File, Open Raster…” and load the original image. Then, click “File, Load GCP Points…” and load those points you just saved.
Go to “Settings, Transformation Settings” and choose the name of the output file.
Finally, click “Start Georeferencing” button to run the Georeferencer.
Done!
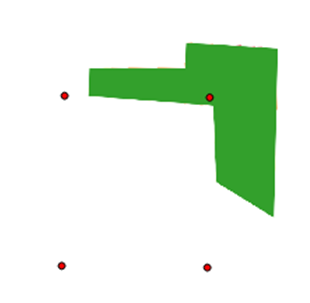
Hey, and don’t worry about these red dots in the places where your points used to be – these are not printed in the Print Layout.
Edit the figure on GIMP before geolocating (optional)
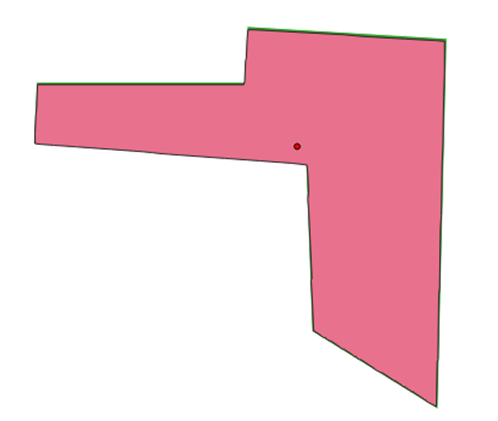
What if what you really want is the location of the green polygon? How can you delete everything else such as the raster in the background?
Also, the symbology, the large coordinates, this all can be annoying to see in the project.
What you can do about that is pre-editing your raster on GIMP.
Open GIMP and use the Paint Bucket and the Paint Brush to color everything else white, leaving only the polygon. Save it with the same size and dimensions as your old file (this is important!). Close GIMP.

Open QGIS Georeferencer again. Do the same process as you did for the figure without grids. Load the figure, load the points, choose the output name, and click Start Georeferencing.
You should see the raster polygon on the QGIS 3.18 main screen.
Alter the symbology of your new georeferenced layer (optional)
Oh, but you did not want the raster-polygon you just generated to be green. Can you make it red?
You sure can.
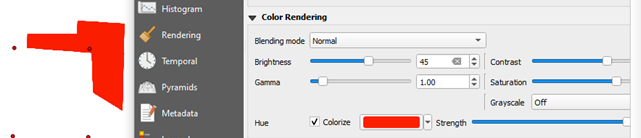
The georeferenced images are created as multiband rasters, with three bands: Red, Green and Blue. Adjusting which is which and how much of each will appear can help you to change green to red.
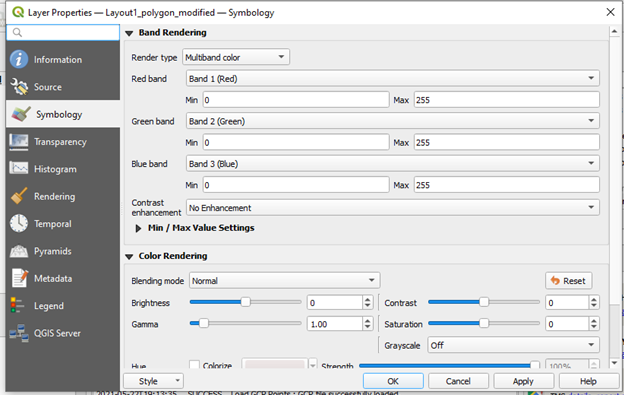
Click with the right button on the layer and then click Properties. Choose Symbology on the left menu.
This is the default visualization:
Mix the bands, leaving the green band (which you want to use) in the Red band.
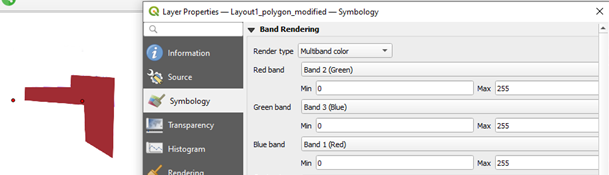
Different tones of red can be achieved by adjusting the various settings on the “Color Rendering” menu.
Make the added layer transparent (optional)
You can set white as a transparent color. Clicking the right button over the layer, choose Properties, and then Transparency, in the left menu.
Click the plus sign to add values manually.
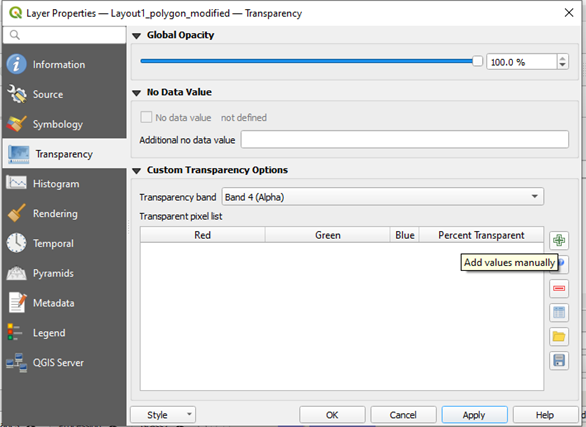
Fill the Red, Green and Blue Columns with 255, click Apply

Now, anything you add on the background will appear beneath the raster layer.
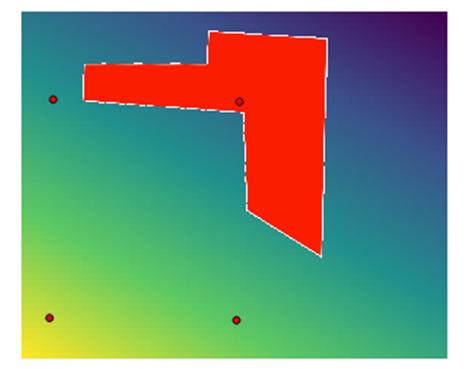
It has some visible white borders, though. These are pixels that are not red but are not quite white either. They were probably created by an anti-aliasing technique of one of the softwares used. To delete them, one possibility is to use “Add Values from display” located right below “Add values manually” to add the pixel values to the table. This will probably take a long time, but the result is generally good.
Another possibility is to vectorize this polygon, which once was a vector, in somebody’s geoprocessing software.
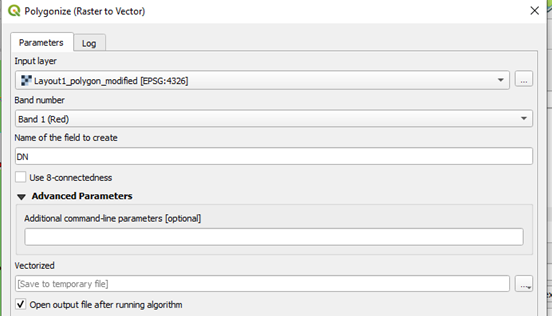
Search for the tool “Polygonize” on the Processing Toolbox.
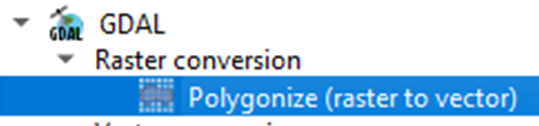
Choose the band accordingly. In my case, it can be any of them.
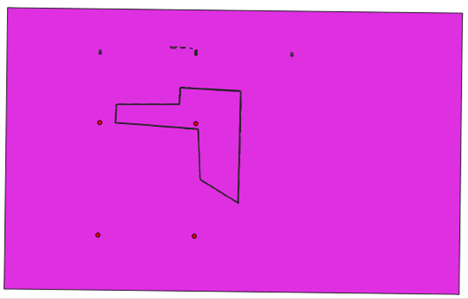
I got this:
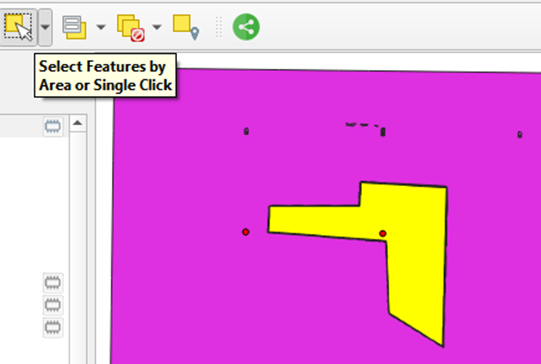
Select the polygon that you want to save.
Right click on the layer and then “Export, Save Selected Features as”
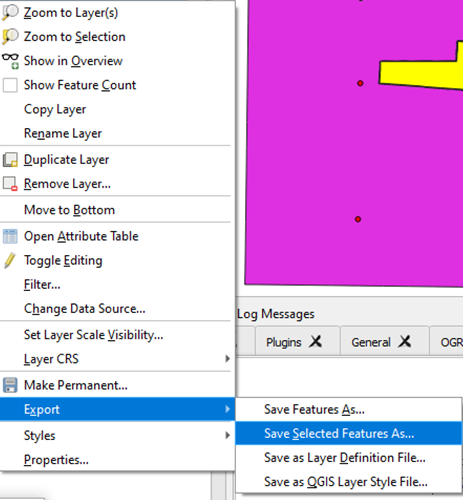
Done! You have successfully extracted the polygon layer.
Extras
OK, but is this polygon that I generated accurate?
It depends on the quality of the starting image. The better the quality, the better the result.
Because I have the originating polygon, and the polygon generated by this process, we can now compare both.
Without zooming in them, we cannot see any differences:
Zooming in, we can see the difference, and measure it:
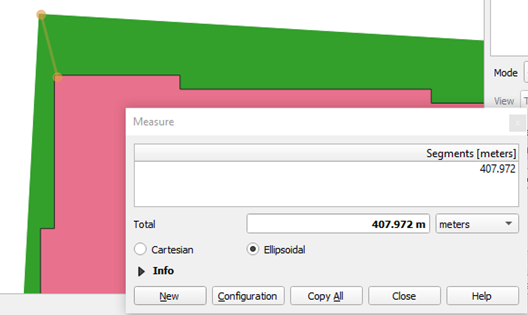
Pixel size of the raster was approx. 1 degree, which is a big pixel. When projecting the original raster to UTM, the resulting pixel size was 1029.42 m.
407.97/1029.42 = 39.6% of a pixel. But, of course, it could be larger. So, if the vector is useful for anything other than plotting it in a map of the same scale you were seeing it, it depends on your application and which is you needed precision.
Luísa Vieira Lucchese
Research Assistant Professor
Research Assistant Professor at University of Pittsburgh