How to generate a Leaflet.js webmap on QGIS with qgis2web plugin, and how to adjust some fundamental features on the map directly on html and JavaScript
Plus: how to add mouse pointer coordinates to your Leaflet webmap
Fellow researchers and open-source GIS enthusiasts,
Welcome to my blog!
I’d like to start with a disclaimer – I may be a researcher of this very area but that doesn’t mean everything I do or write here will work for you, in your own desktop configurations and package versions. I have no responsibility if you lose data or mess up your installation. I also do not authorize any copies of my content.
Last week, I showed a workaround to avoid qgis2web generate a webmap preview when you change the map type, freezing QGIS. Today, I will still be discussing qgis2web, but the adjustments to make on the map after exporting.
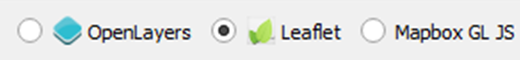
Qgis2web is used to export your current QGIS project as a webmap. To do that, you can choose between the (currently, version 3.16) three types of webmap: OpenLayers, Leaflet, and Mapbox GLJS. All of them generate simple, but good-looking maps, with contemporary style. My favorite is Leaflet, also called Leaflet.js, which is relatively light to load, and has solid documentation to support its use.
Leaflet maps can definitely be generated from scratch. Many people and companies do that. But, because I am a QGIS enthusiast and many of my maps are already on QGIS projects, I can get the best of both worlds. I generate my basic map using as many specifications available on qgis2web as possible, and then, edit the html and the JavaScript generated by the plugin to adjust the map to my needs. In this post, I am going to explain how I take advantage of qgis2web to generate a basic webmap, and what I should look out to alter after the map export. Plus, I will show you how to implement Leaflet.MousePosition to show the coordinates on hover.
A simplified version of the webmap I show how to generate in this post can be loaded by clicking on the button below. Please notice that this map can take some time to load in slower connections.
This map was generated by qgis2web plugin on QGIS, and further edited directly on the generated code. No advanced coding skills are required to do such modifications, although this will be easier if you have basic coding skills.
For the next steps, I will be using QGIS 3.16 “Hannover” Desktop. Data used: Natural Earth public domain land cover, rivers, and lakes, Google Maps © Google base map.
First: open your QGIS project and adjust the symbology
Before exporting your map, you should adjust the symbology as much as possible, so that it looks how it should look on your webmap. Keep in mind that large rasters take some time to export and may not load correctly in some browsers. Base maps, however, are usually loaded on demand. Some styling, such as labels styles, may not be 100% translated to Leaflet.
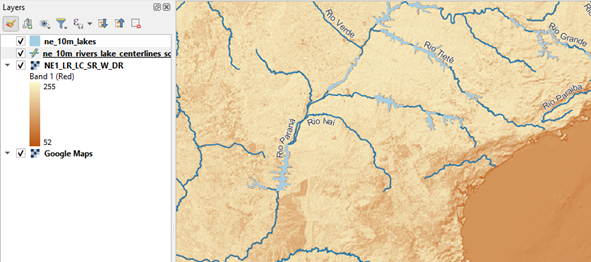
For this step, I load the data and zoom to a location on Brazil. I adjusted the symbology of the lakes and rivers and added labels to the rivers. The names did not have a prefix, so I created a new field on the attribute table to add the word “Rio” before the river names – it means “river” in Portuguese.
Open qgis2web window and select Leaflet
If your data is heavy, uncheck all layers before changing the map type, and do not update the preview. I explain why in this post.
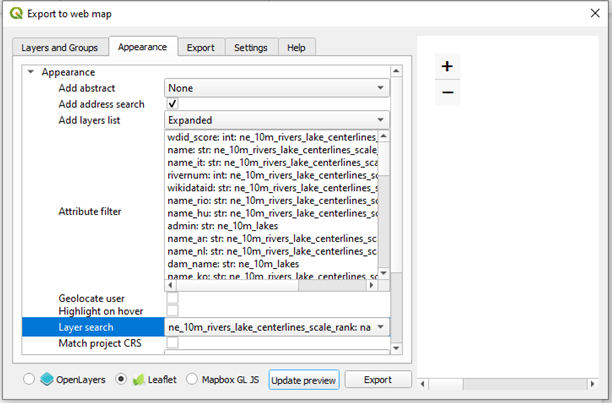
Look closely at the options and choose the appropriate settings
For my project, I will want an expanded list of layers since the Google Maps layer will be below the other layers. I activated the address search, so that the user will be able to search for specific locations.
In this plugin, the template can be either canvas-size or full-screen.
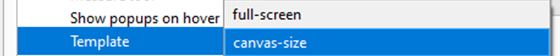
Full-screen will set the map to occupy 100% of height and width available, while canvas-size will provide a map with fixed size in pixels, equal to your view on QGIS. But don’t worry, we can alter this later easily. For this example, I will generate a canvas-size map.
The minimum and maximum zoom are also easily changeable directly on the generated map. I will set my maximum zoom to level 15, and minimum to 2.
The other settings, I will not alter at this time.
Export the map.
Look at your map on the browser
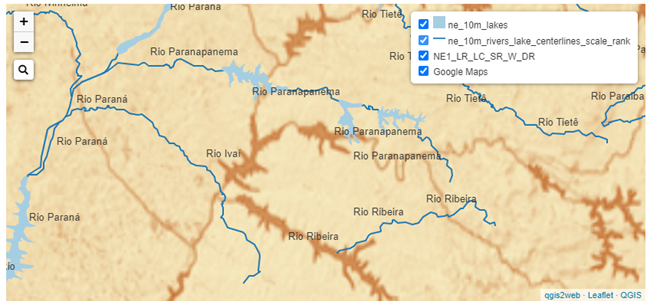
So far, satisfied with your map? If yes, move on.
Let’s look at the html code generated by qgis2web
Open the folder where the map was saved. If it is a temporary folder, you might want to move it to a permanent location.
Inside the folder you will find something like this:
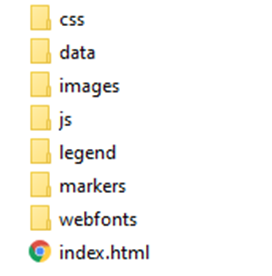
Open the index.html in an editor. I am using the traditional Vim. Notice the part:
        #map {
            width: 824px;
            height: 388px;
        }
This is the canvas-size template. Change the width and height of the generated map as you please. Examples:
        #map {
            width: 70%;
            height: 60%;
        }
        #map {
            width: 50em;
            height: 50em;
        }
This is where the links in the bottom right are generated:
map.attributionControl.setPrefix('<a href="https://github.com/tomchadwin/qgis2web" target="_blank">qgis2web</a> · <a href="https://leafletjs.com" title="A JS library for interactive maps">Leaflet</a> · <a href="https://qgis.org">QGIS</a>')
In this part, the Google Maps layer is loaded:
        map.createPane('pane_GoogleMaps_0');
        map.getPane('pane_GoogleMaps_0').style.zIndex = 400;
        var layer_GoogleMaps_0 = L.tileLayer('https://mt1.google.com/vt/lyrs=m&x={x}&y={y}&z={z}', {
            pane: 'pane_GoogleMaps_0',
            opacity: 1.0,
            attribution: '',
            minZoom: 2,
            maxZoom: 15,
            minNativeZoom: 0,
            maxNativeZoom: 19
        });
        layer_GoogleMaps_0;
        map.addLayer(layer_GoogleMaps_0)
minZoom and maxZoom values were filled by qgis2web. Notice that Google Maps is added to the map with z index of 400. Anything with a z index higher than 400 will be placed above Google Maps layer, and anything with a z index lower than 400 will be placed below it.
If you choose to alter the minimum and maximum zoom levels, remember to also alter them at:
        var map = L.map('map', {
            zoomControl:true, maxZoom:15, minZoom:2
The raster layer is added on:
        map.createPane('pane_NE1_LR_LC_SR_W_DR_1');
        map.getPane('pane_NE1_LR_LC_SR_W_DR_1').style.zIndex = 401;
        var img_NE1_LR_LC_SR_W_DR_1 = 'data/NE1_LR_LC_SR_W_DR_1.png';
        var img_bounds_NE1_LR_LC_SR_W_DR_1 = [[-89.99999999998198,-180.0],[90.0,179.99999999996396]];
        var layer_NE1_LR_LC_SR_W_DR_1 = new L.imageOverlay(img_NE1_LR_LC_SR_W_DR_1,
                                              img_bounds_NE1_LR_LC_SR_W_DR_1,
                                              {pane: 'pane_NE1_LR_LC_SR_W_DR_1'});
        bounds_group.addLayer(layer_NE1_LR_LC_SR_W_DR_1);
        map.addLayer(layer_NE1_LR_LC_SR_W_DR_1);
Notice that the z index of this layer is 401, which means it will be placed above Google Maps.
Then, you have the popups definition, and this part is interesting:
        function style_ne_10m_rivers_lake_centerlines_scale_rank_2_0() {
            return {
                pane: 'pane_ne_10m_rivers_lake_centerlines_scale_rank_2',
                opacity: 1,
                color: 'rgba(31,120,180,1.0)',
                dashArray: '',
                lineCap: 'square',
                lineJoin: 'bevel',
                weight: 2.0,
                fillOpacity: 0,
                interactive: true,
            }
In this part, many attributes of the vector layer can be altered, such as color and line style. If I scroll down, I will find a similar definition for the lakes layer:
        function style_ne_10m_lakes_3_0() {
            return {
                pane: 'pane_ne_10m_lakes_3',
                opacity: 1,
                color: 'rgba(166,206,227,1.0)',
                dashArray: '',
                lineCap: 'butt',
                lineJoin: 'miter',
                weight: 1.0,
                fill: true,
                fillOpacity: 1,
                fillColor: 'rgba(166,206,227,1.0)',
                interactive: false,
            }
        }
This part controls the labels of the river layer:
layer.bindTooltip((layer.feature.properties['name_rio'] !== null?String('<div style="color: #323232; font-size: 10pt; font-family: \'Arial\', sans-serif;">' + layer.feature.properties['name_rio']) + '</div>':''), {permanent: true, offset: [-0, -16], className: 'css_ne_10m_rivers_lake_centerlines_scale_rank_2'})
OK, these are the basics. Now, we can do some adjustments.
Adjustment: remove one layer
My map has one too many layers. I want to remove the raster layer, to make it lighter to load.
There are two places on the JavaScript code I have to alter:
- The definition of the layer
Remove or comment anything from the “map.createPane” to the “map.addLayer”. Example:
      /*map.createPane('pane_NE1_LR_LC_SR_W_DR_1');
        map.getPane('pane_NE1_LR_LC_SR_W_DR_1').style.zIndex = 401;
        var img_NE1_LR_LC_SR_W_DR_1 = 'data/NE1_LR_LC_SR_W_DR_1.png';
        var img_bounds_NE1_LR_LC_SR_W_DR_1 = [[-89.99999999998198,-180.0],[90.0,179.99999999996396]];
        var layer_NE1_LR_LC_SR_W_DR_1 = new L.imageOverlay(img_NE1_LR_LC_SR_W_DR_1,
                                              img_bounds_NE1_LR_LC_SR_W_DR_1,
                                              {pane: 'pane_NE1_LR_LC_SR_W_DR_1'});*/
        //bounds_group.addLayer(layer_NE1_LR_LC_SR_W_DR_1);
        //map.addLayer(layer_NE1_LR_LC_SR_W_DR_1);
- In the list of layers
In the layers list, you should also remove the layer. Example:
        // L.control.layers(baseMaps,{'<img src="legend/ne_10m_lakes_3.png" /> ne_10m_lakes': layer_ne_10m_lakes_3,'<img src="legend/ne_10m_rivers_lake_centerlines_scale_rank_2.png" /> ne_10m_rivers_lake_centerlines_scale_rank': layer_ne_10m_rivers_lake_centerlines_scale_rank_2,"NE1_LR_LC_SR_W_DR": layer_NE1_LR_LC_SR_W_DR_1,"Google Maps": layer_GoogleMaps_0,},{collapsed:false}).addTo(map);
        L.control.layers(baseMaps,{'<img src="legend/ne_10m_lakes_3.png" /> ne_10m_lakes': layer_ne_10m_lakes_3,'<img src="legend/ne_10m_rivers_lake_centerlines_scale_rank_2.png" /> ne_10m_rivers_lake_centerlines_scale_rank': layer_ne_10m_rivers_lake_centerlines_scale_rank_2,"Google Maps": layer_GoogleMaps_0,},{collapsed:false}).addTo(map);
Change Layer order
To change the layer order, rearrange the z index of each layer. Lower z indexes layers will be placed below.
Change Layer name
You do not need to change the layer name in every place on the file. You can simply change it on the layers panel.
In my example, I replaced “layer_ne_10m_lakes_3” by simply “lakes”.
L.control.layers(baseMaps,{'<img src="legend/ne_10m_lakes_3.png" /> lakes': layer_ne_10m_lakes_3,'<img src="legend/ne_10m_rivers_lake_centerlines_scale_rank_2.png" /> ne_10m_rivers_lake_centerlines_scale_rank': layer_ne_10m_rivers_lake_centerlines_scale_rank_2,"Google Maps": layer_GoogleMaps_0,},{collapsed:false}).addTo(map);
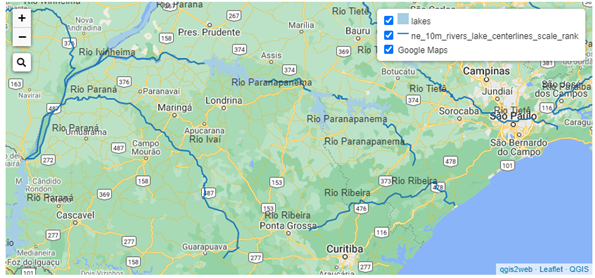
At this point, the map looks like this:
Change canvas size
Simply alter the width and height of the map. For best results on responsive pages (desktop and mobile-friendly), choose either a percentage of the screen or base it on a unit that varies with the screen size. Another option is to wrap it on a bootstrap JS flexible container.
I set:
        #map {
            width: 98%;
            height: 30em;
        }
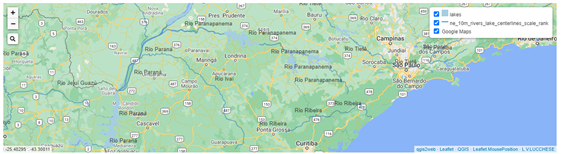
How it looks on Desktop:
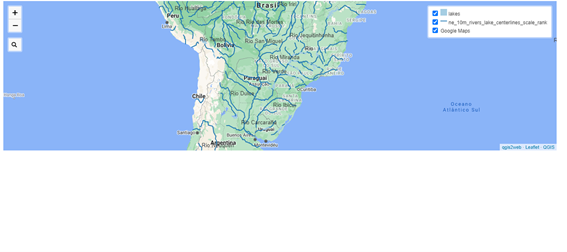
How it looks on Mobile:
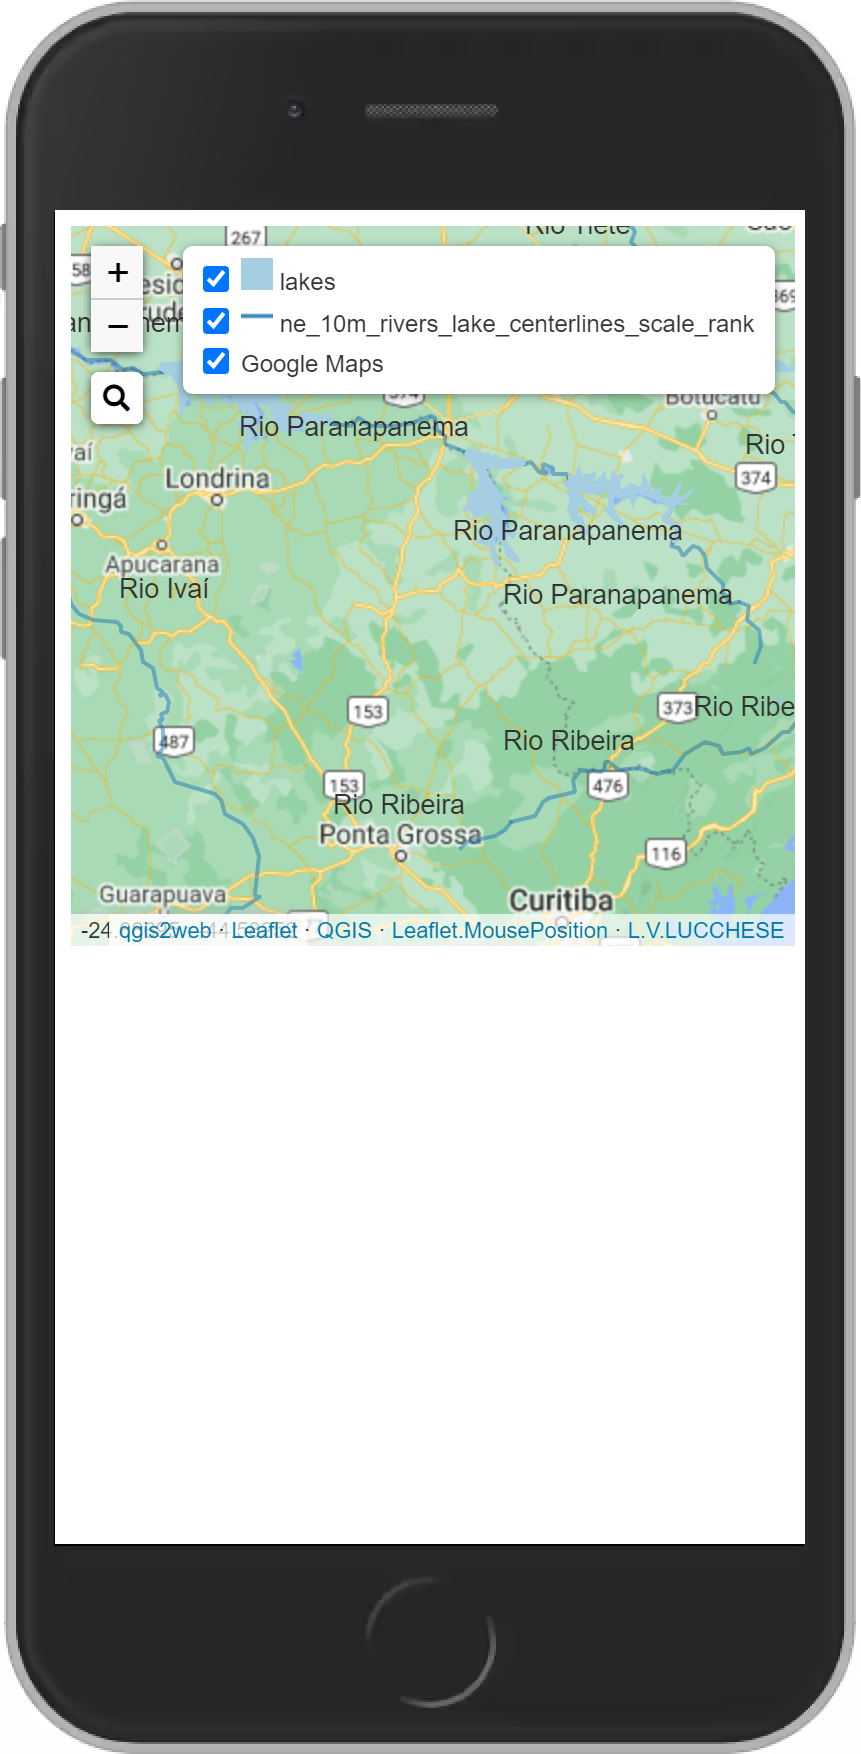
So functional!
Change color and add transparency to a layer
To change color and alpha of a layer, you should alter this definition
color: 'rgba(31,120,180,0.5)',
In which the color is given by RGB (Red, Green and Blue intensities) and the last value is the alpha. When alpha is 1, the layer is in full opacity, and when alpha is 0, the layer is totally transparent. I chose 0.5 so it is 50% transparent.
Add coordinates on hover
You probably noticed that the generated map does not show the coordinates of where your mouse is hovering.
I like to have this information on my maps, so I searched around and found this implementation by Ardhi Lukianto: Leaflet.MousePosition. It is available under MIT License.
Notice that this is not the only option. On Leaflet website there is a list of implementations to show mouse coordinates.
Edit (July 12, 2021, 9 PM): Tiago Sousa from the QGISBrasil group recalled that it is still possible to implement the coordinates yourself using L.Control and a mousemove event listener. An example is available in this GIS StackExchange answer, but when using it, pay attention to three important changes: 1) the last right bracket is extra; 2) the map generated by qgis2web is simply called “map” instead of “leafletMap”; 3) the expression “LatLng” will be shown right before the coordinates, but this can be changed simply by deleting this expression in the code and leaving an empty space between the double quotes where it was.
How to implement Leaflet.MousePosition to your map:
Download the source code from GitHub (or git clone it)
Distribute in the right folders
To keep your project organized, you should keep the CSS in the css folder, the JavaScript in the js folder, and so on.
- Call the files in your index.html
On the html head add:
<link rel="stylesheet" href="css/L.Control.MousePosition.css">
On the html body add:
<script src="js/L.Control.MousePosition.js"></script>
- Paste the following line on your script (inside script tags) on index.html
L.control.mousePosition().addTo(map);
- Credit the authors
Leaflet.MousePosition is distributed under MIT License, which means you need to acknowledge the author and repository.
When using Google basemaps, you should also acknowledge their use and Google copyright.
You should also acknowledge the use of qgis2web.
You don’t need to acknowledge me, but I would surely appreciate if you did, by either an acknowledgement, a link, or simply telling your friends!
- Enjoy your map
At this point, the map looks like this:
You can see the coordinates in the bottom left. Check the options on the repository page to see how you can customize your coordinate representation.
Notice I added the references to Leaflet.MousePosition repository and to this website to the bottom right. I did the same on the example map shown in the beggining of this post.
Enjoy your mapping!
Extras
Why are the labels much simpler than in QGIS?
Not every aspect of your map can be translated to the final webmap, and labels are one of these features that can only be partly translated by the current qgis2web version.
Why is my map taking so long to load on the browser?
Are you using big data? Heavy rasters, especially, make the map slower to load.
I got the following error when trying to export the map on qgis2web:
“An error has occurred while executing Python code:
FileNotFoundError: [Errno 2] No such file or directory: ‘…Temp\\NE1_LR_LC_SR_W_DR11625779206_piped_3857.tif'
Traceback (most recent call last):
  File "…\qgis2web\utils.py", line 424, in exportRaster
    processing.run("gdal:translate", {"INPUT": piped_3857,
  File "…\general.py", line 108, in run
    return Processing.runAlgorithm(algOrName, parameters, onFinish, feedback, context)
  File "…\Processing.py", line 168, in runAlgorithm
    raise QgsProcessingException(msg)
_core.QgsProcessingException: Unable to execute algorithm
Could not load source layer for INPUT: …\..._piped_3857.tif not found
During handling of the above exception, another exception occurred:
Traceback (most recent call last):
  File "…\maindialog.py", line 348, in saveMap
    results = writer.write(self.iface,
  File "…\leafletWriter.py", line 90, in write
    self.preview_file = self.writeLeaflet(
  File "…\leafletWriter.py", line 202, in writeLeaflet
    exportRaster(layer, lyrCount, layersFolder,
  File "…\utils.py", line 444, in exportRaster
    shutil.copyfile(piped_3857, out_raster)
  File "…\shutil.py", line 264, in copyfile
    with open(src, 'rb') as fsrc, open(dst, 'wb') as fdst:
FileNotFoundError: [Errno 2] No such file or directory: '…piped_3857.tif'
Python version: 3.9.5 (tags/v3.9.5:0a7dcbd, May  3 2021, 17:27:52) [MSC v.1928 64 bit (AMD64)]
QGIS version: 3.20.0-Odense Odense, decaadbb31”
I had this issue on QGIS 3.20.0 “Odense”, but ran the export on QGIS 3.16 (the LTS version) and all went well. I suggest you try the same. It appears to be connected to raster export and to the projection used on the QGIS project.
Luísa Vieira Lucchese
Research Assistant Professor
Research Assistant Professor at University of Pittsburgh