A draggable Truesize Leaflet map of the Brazilian states, and how to do the same for your own country or region
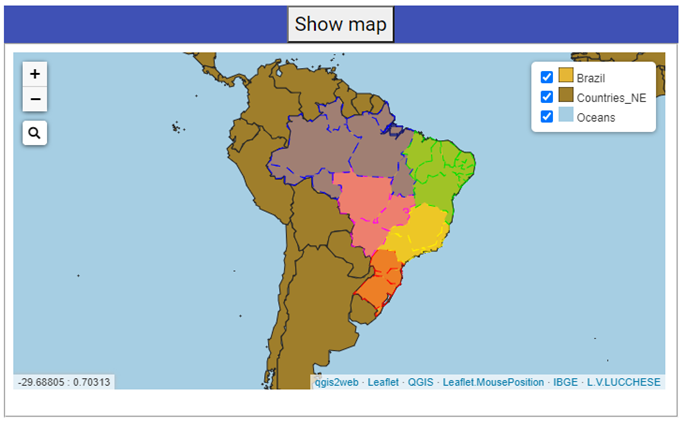 screenshot of the truesize webmap of Brazilian states
Fellow researchers and open-source GIS enthusiasts,
Welcome to my blog!
I’d like to start with a disclaimer – I may be a researcher of this very area but that doesn’t mean everything I do or write here will work for you, in your own desktop configurations and package versions. I have no responsibility if you lose data or mess up your installation. I also do not authorize any copies of my content.
Last week I explored a bit of how to make a Leaflet.js map using qgis2web plugin on QGIS and altering the code after the map creation. As I was exploring the numerous plugins available for Leaflet.js, I saw Leaflet Truesize plugin and that caught my eye. Now, you must have seen those maps in which you can drag world countries to compare their sizes and shapes, especially because the areas of the off-tropic regions are deformed in the most common projections. The Leaflet Truesize plugin itself is inspired in the The True Size of… website.
However, in such maps, usually limited options of draggable polygons are available. The good news is that using Leaflet Truesize plugin, you can add your own customized draggable polygons to the map.
A map that I thought almost immediately is the representation of the draggable Brazilian states, so you could compare them to each other and to the size of other countries. And that is why this is used as an example for this tutorial.
Show me the map!
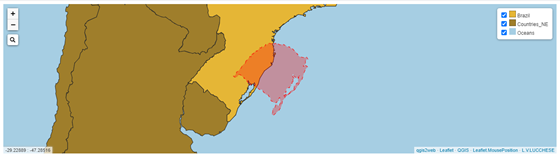
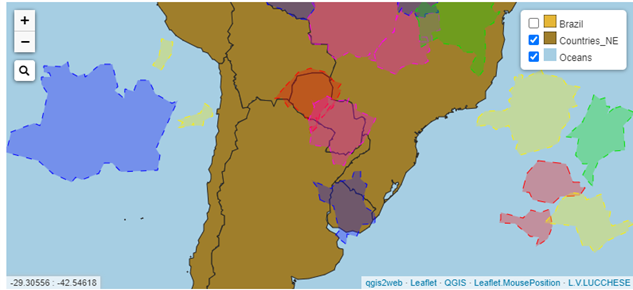
If you are here for the map, here it is!
Click in Show Map to see it. It may take some time to load on slow connections.
Data sources: Natural Earth, IBGE.
Different colors represent the different regions of Brazil: south, southeast, center-west, north and northeast.
If you are a teacher and want to use this map for school classes or any class really, use it at your will. If you need an offline version, you can save the html of this map and open it offline at the classroom computer (it should work). But if you have any trouble doing that, you can contact me by email.
Tutorial on how to do it yourself
In this quick tutorial, I will show you how to add a Leaflet Truesize draggable layer to your Leaflet webmap.
The data employed for this quick tutorial are the countries division by Natural Earth and the Federative Units (states and the Federal District), updated on 2020, by Instituto Brasileiro de Geografia e Estatística (IBGE). I also cite the state shapefiles from NEREUS of Universidade de São Paulo.
I will use QGIS 3.16.9 to generate the polygons for the map.
First, add the plugin to your map
According to the instructions of the plugin manager the user can either install the plugin or download the source code directly. I chose to download the source code. I saved it with the name leaflet-truesize.js on the js folder of my Leaflet.js map project. If you don’t have this folder, you can save it on the same folder as your html file, but be wary when you add any paths to take out the “/js/”.
Then, go to your html file and add to the html body:
<script src="js/leaflet-truesize.js"></script>
Prepare the polygon to be added on the map using QGIS
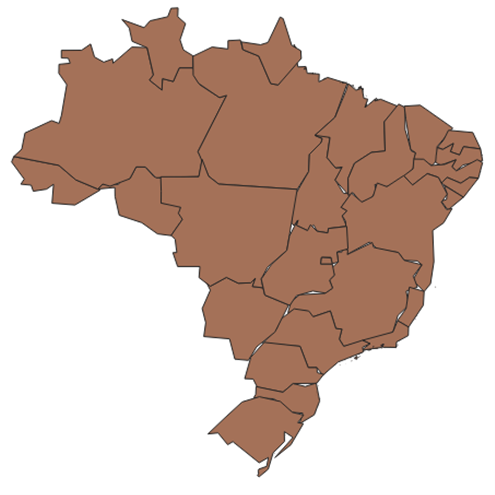
Of course, I will start with my home state, Rio Grande do Sul, the southernmost state of Brazil.
I open, on QGIS 3.16.9, the shapefile of Brazil and its Federative Units, by IBGE.
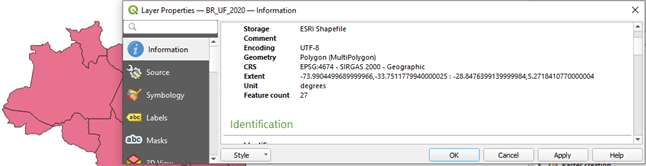
Looking into its properties, I see that the type of Geometry is MultiPolygon. Unfortunately, I could only make Leaflet Truesize work with Polygon geometry. I tried to add a Multipolygon, but it didn’t work (the object generated for me is not mobile). But the repository of the plugin says that it can support Multipolygon, so maybe the downloadable version was not updated yet, or maybe I did something wrong? But, if you make it work with Multipolygons, go for it!
Anyway, the good news is that you can easily generate a single polygon to represent each area. Another possibility would be to use the NEREUS-USP dataset (http://www.usp.br/nereus/?dados=unidades-federativas), which are polygon-based shapefiles.
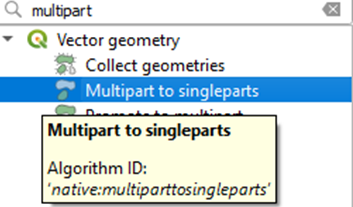
To transform multipolygons to polygons, use the tool “Multipart to singleparts”.
I applied that to my original shapefile and got:
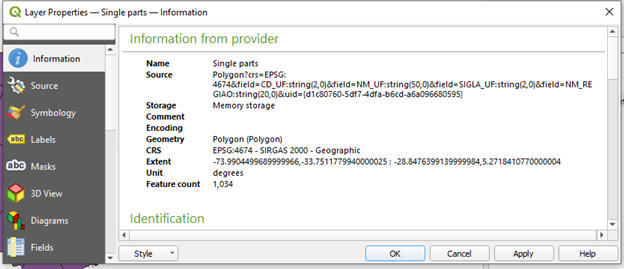
Now we can see that the Geometry type is Polygon.
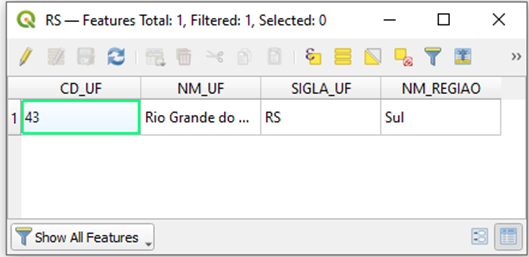
When I go to the attributes table, I can see that there are many polygons that delimitate the state of Rio Grande do Sul (RS):
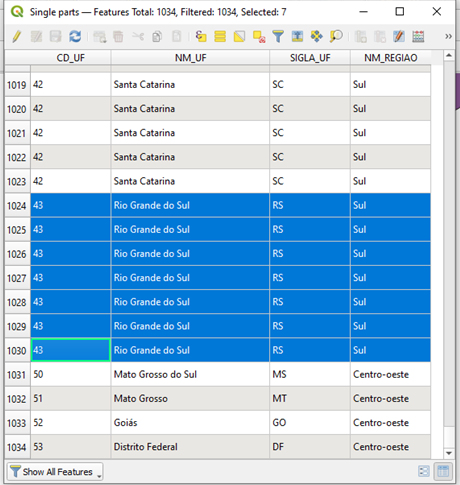
Nevertheless, for Leaflet Truesize we must provide only one polygon. Probably, there is more than one polygon because there are such things as islands that belong to the Brazilian states.
To know which polygon is more representative of RS, I use the Select Features by Area or Single Click tool.
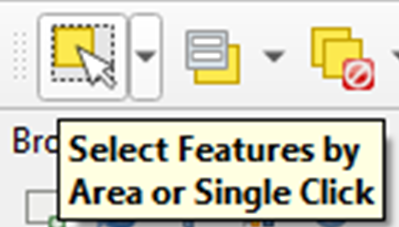
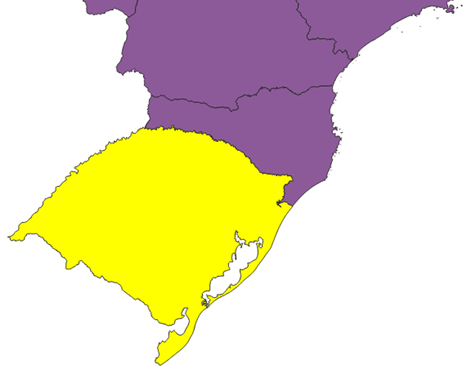
Using this tool, I single click the area of the largest region of RS:
Right-click the layer and Save Selected Features as…
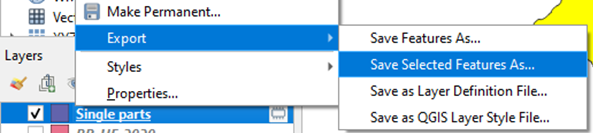
On save, choose the format of the feature as GeoJSON.
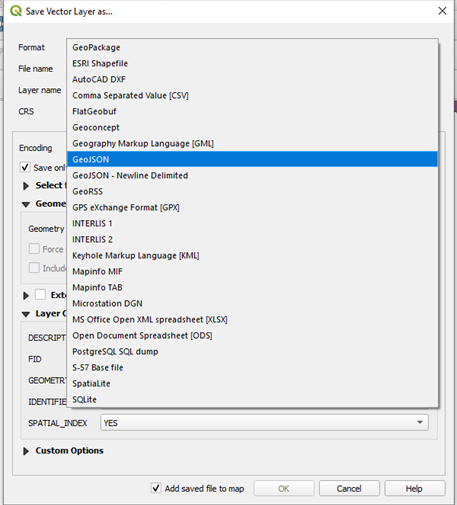
Save it. Now, when you open the attribute table, you will find just one polygon. This is what we are looking for.
Prepare the script to receive the draggable layer
Open the html code of your webmap. Inside script tags, using JavaScript, create the pane and give it a unique name.
        map.createPane('pane_RS');
        map.getPane('pane_RS').style.zIndex = 405;
        map.getPane('pane_RS').style['mix-blend-mode'] = 'normal';
Also, create the feature:
const RS_geojson = {
  		type: 'Feature',
  		properties: {},
  		geometry: {
   		 type: 'Polygon',
   		 coordinates: [] }
	};
The coordinates part will be filled later.
Create the True Size layer:
        const trueSizeLayer = new L.trueSize(RS_geojson, {
         color: '#FF0000',
	 pane: 'pane_RS',
         weight: 1,
         opacity: 1,
         dashArray: '7, 10',
        }).addTo(map);
Adjust the color of the overlay layer on color. This default will provide a red draggable layer.
To alter the border color, alter the “color” option, and to alter the fill color, add a fillcolor, in the same mold as the color. I also had to delete the part of leaflet-truesize.js with the definition of the fillColor for the color of the polygons to change. To create a continuous line border, just delete the “dashArray”. Example:
        const trueSizeLayer = new L.trueSize(RS_geojson, {
         color: '#FFF000',
         fillcolor: '#FFF000',
         pane: 'pane_RS',
         weight: 1,
         opacity: 1,
        }).addTo(map);
Copy the geometry from the GeoJSON file into the JS.
Open the GeoJSON file. I opened mine on Vim.
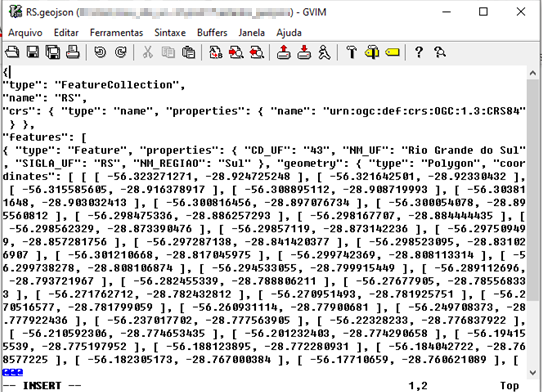
Copy the coordinates (everything after coordinates and before the braces “}”).
Paste the coordinates into their place.
coordinates: [ [ [ -56.323271271, -28.924725248 ], …]] }
Test the webmap
Double-click index.html (or the name of your html file) and try to move the layer around.
Mine works like a charm!
Do the same for each state or polygon
So easy, right? Good! 26 states to go…
I was simply saving all GeoJSONs and repeating the process on the html file. However, some states have many vertices and that makes the final html very heavy.
Simplify polygons (optional)
To simplify the polygons and therefore make the map lighter, use the Simplify tool on QGIS.
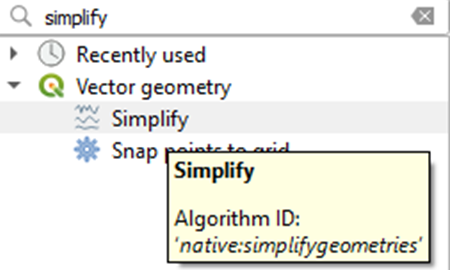
For the Brazilian states, I thought 0.25° tolerance on the distance (Douglas-Peucker) algorithm generated a satisfactory result:
There is a warning on the Simplify algorithm that says you should be careful when using geographic degrees as a unit for simplification, but I am not comfortable projecting the whole country in the same projected coordinate system, because it would greatly distort some parts of Brazil. For smaller countries, it might be a good option. Or, I could reproject each state on its suitable projection, and then perform the calculations, but that would be too much of a hassle for a map that is supposed to be used only for gross comparisons – I do not mean to be 100% precise here.
This polygon simplification makes the resulting Leaflet webmap roughly ~500x lighter.
Observations
Remember to change the z-index of each layer to control which one goes on top of the other when they intersect.
Remember to change the name of the constant “trueSizeLayer” for each draggable layer you add.
In order to be able to change the color of the draggable polygon, I removed the fillcolor definition on leaflet-truesize.js.
Done!
The map shown on the start of the post was generated through this pipeline.
Luísa Vieira Lucchese
Research Assistant Professor
Research Assistant Professor at University of Pittsburgh