Using SAGA Raster Calculator on QGIS - a quick tutorial
Fellow researchers and open-source GIS enthusiasts,
Welcome to my blog!
I’d like to start with a disclaimer – I may be a researcher of this very area but that doesn’t mean everything I do or write here will work for you, in your own desktop configurations and package versions. I have no responsibility if you lose data or mess up your installation. I also do not authorize any copies of my content.
Today, I am presenting a quick tutorial for using the SAGA GIS Raster calculator on QGIS. I am using QGIS 3.18 “Zürich” for this tutorial.
The SAGA Raster calculator is useful because it allows to make some calculations that the regular QGIS Raster Calculator does not. Especially, it allows us to use the X and Y coordinates of the raster as inputs for our calculations.
How do we start?
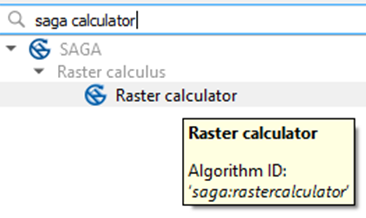
Find the SAGA Raster calculator on the Processing Toolbox
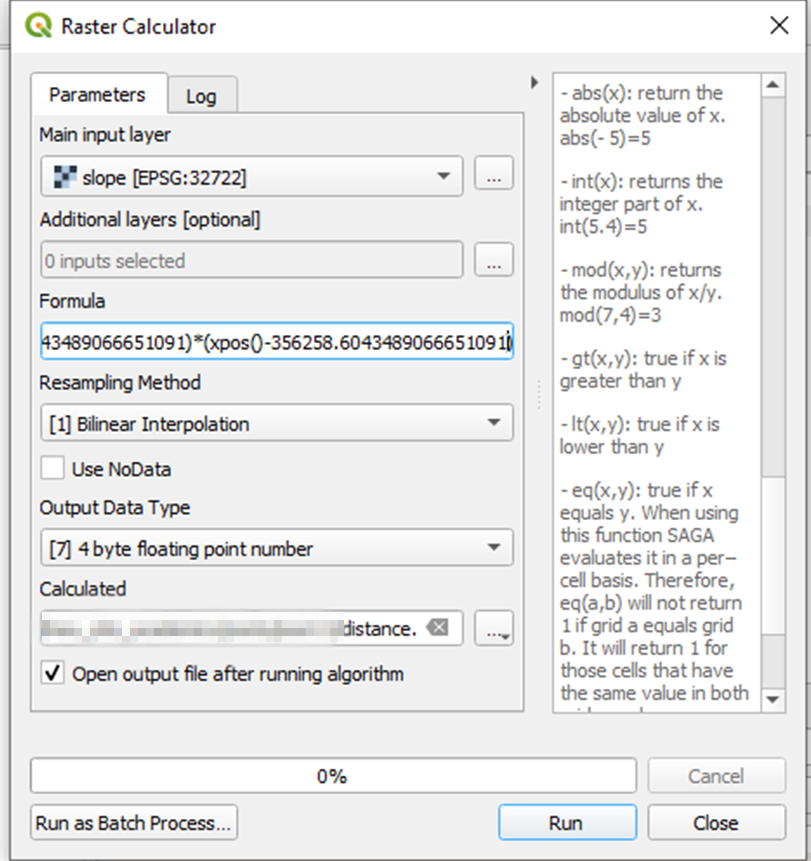
SAGA Raster calculator window
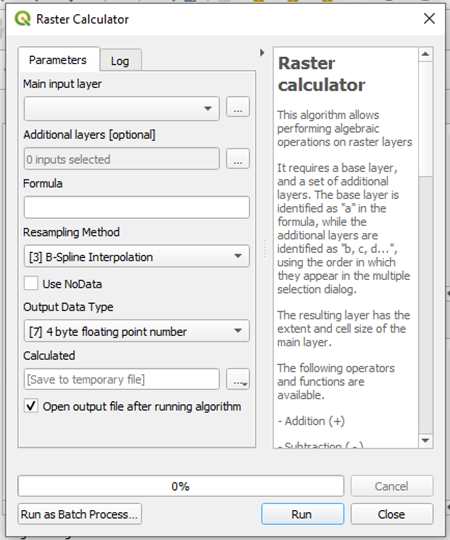
This is the initial window of SAGA Calculator on QGIS.
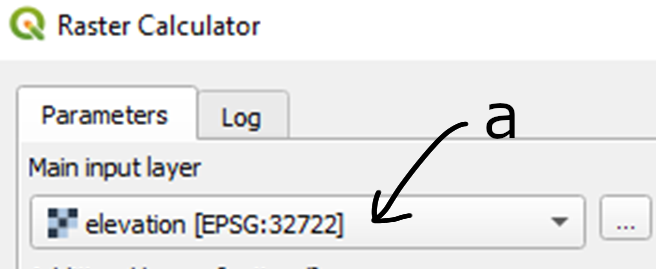
Main input layer
The main input layer can be either chosen from a list of layers in the project or loaded by clicking the three points on the right side.
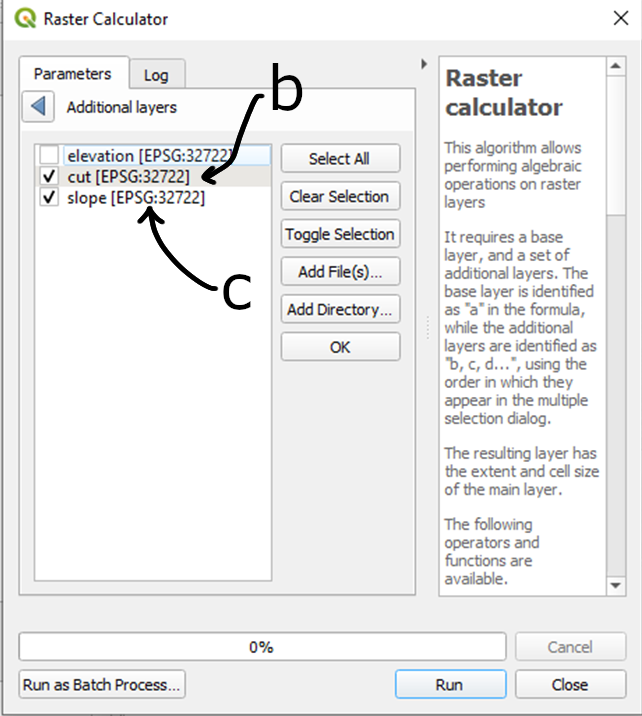
Additional layers [optional]
The calculations you are going to perform can either use just one layer, or more than one. If you wish to use more than one raster layer as input, load the other raster layers by clicking the three points on the right.
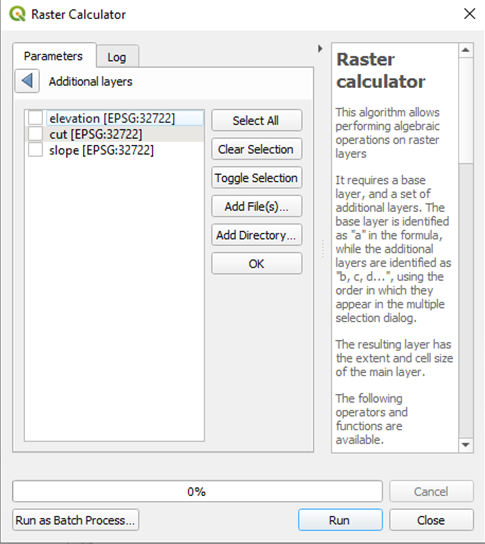
To load a different file, click on “Add File(s)…” button.
Formula
In this area, you will write the formula of the calculation you wish to perform. We will get back to this later.
Resampling method
There are four options available for the interpolation.
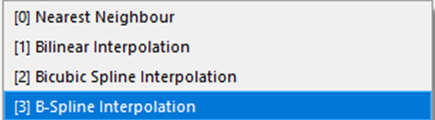
[0] Nearest Neighbour: gets the value of the closest pixel and does not do any interpolation. Quicker, but less precise.
[1] Bilinear Interpolation: linear interpolation in both directions X and Y.
[2] Bicubic Spilne Interpolation: cubic spline interpolation, in both directions X and Y.
[3] B-Spline Interpolation: base spline interpolation.
Which one should I use?
I recommend not using Nearest Neighbor, except if you know that the distance between the grid points of one raster and another is negligible.
Cubic spline is, in theory, more approximate, although, if you know that your raster data has a linear behavior, linear interpolation should suit it.
I generally use option [1] Bilinear Interpolation because the grids I use are usually very close to each other.
Output Data Type

This is to choose the type of the output. If you don’t know which one to choose, a good option is “[7] 4 byte floating point number”, which represents negative and positive numbers, with approximate 10^(-7) precision (machine epsilon). If you need more precision than that, save the result in “[8] 8 byte floating point number”, but be aware that you are using as twice the disk space as in option [7]. The option “[0] bit” is for saving Booleans (0 or 1), and the options 1-6 are used to save integer values. If you use these, however the results of the calculation, they will be approximated to integers. The one that takes the least disk space is “[0] bit” because it uses only one bit to represent each pixel, but its use is limited.
Calculated
Finally, save the resulting raster to either a temporary file, or a location in your computer.
To the Formula
The main input layer is called “a”.
The layers you can select in the Additional Layers, are called “b”, “c”, “d”, in the order that they appear on the list. But only those you select will receive a letter.
Now, as in the QGIS Raster Calculator, you can simply write the expression, e.g.
a+b-c
A list of built-in functions is available here.
Important
Make sure that the rasters are on the same projection before using them in this calculator.
Using the coordinates in SAGA Raster Calculator
To use the coordinates of each point in the calculation, you can use xpos() for the x coordinate and ypos() for the y coordinate. If what you need is the index of the column or row, then row() and col() will do.
Example: using the SAGA Raster Calculator to calculate the distance of each pixel in a raster to a given point
We want to calculate the distance between a given point and all pixels in a raster.
I will use this raster, and this point:
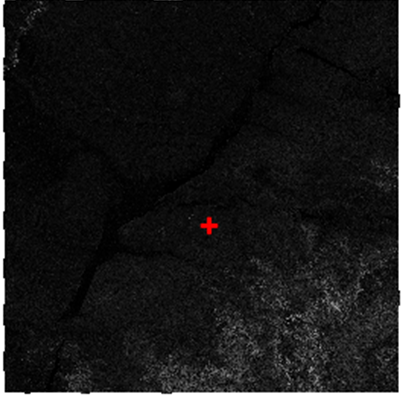
The raster is a slope calculated based on SRTM from this post, based on the data from CIAT-CSI SRTM.
The point is just a point which I created, on the same coordinate system.
I go to the Attribute Table, select all, copy, and then paste it elsewhere, to get the coordinates of the point:
wkt_geom: Point (356258.6043489066651091 7469890.33019922021776438)
First, build the expression
The expression we will use is simply the cartesian distance.
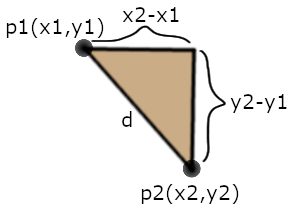
If p1 (coordinates $x_1$ and $y_1$) is the base point, and p2 (coordinates $x_2$ and $y_2$) is the pixel of the raster, then, the distance in $y$ is $y_2-y_1$, and the distance in $x$ is $x_2-x_1$. This means that the distance between the points p1 and p2 is $d$, and $d= \sqrt{(x_2-x_1)^2 +(y_2-y_1)^2}$.
Adapting it to our case, in which $x_1$ and $y_1$ are known, the expression becomes:
d= sqrt((x2-356258.6043489066651091)^2 +(y2-7469890.33019922021776438)^2)
Knowing that $x_2$ is simply xpos() and $y_2$ is ypos(), the expression to be put on the calculator is:
sqrt((xpos()-356258.6043489066651091)*(xpos()-356258.6043489066651091)+(ypos()-7469890.33019922021776438)*(ypos()-7469890.33019922021776438))
Notice that I did not use the “raised to the power of” (^) symbol, because it can generate errors, depending on the expression.
Run it
Results
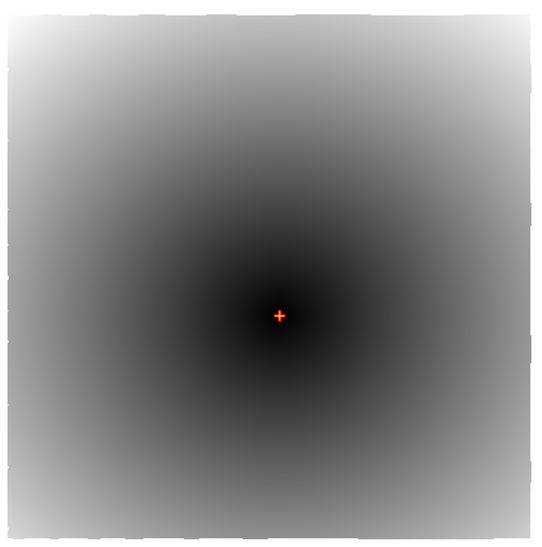
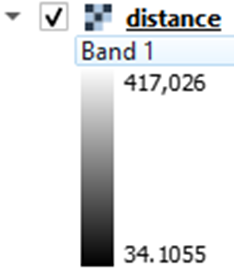
The pixel with the minimum distance from the point is 34.1 m.
If you want to show the areas on the slope raster that are less than 10 km from the point, this can be done in Symbology adjustments. Adjusting the symbology of the layer “distance” accordingly:
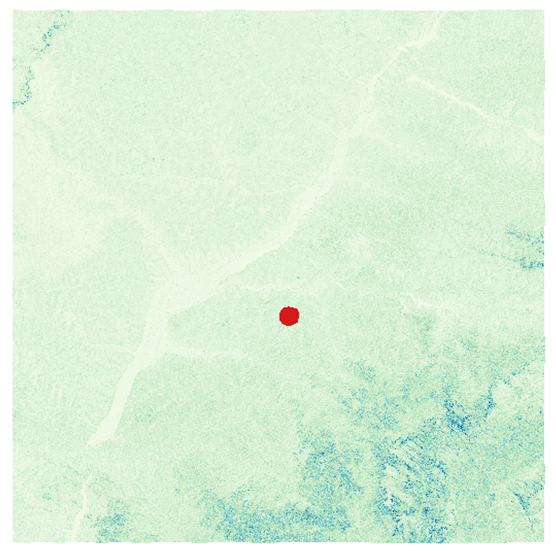
Done!
SAGA GIS Raster Calculator is especially useful for those applications that too complex to be done on the native QGIS Raster Calculator, yet too simple to justify coding in Python.
Extras:
- SAGA GIS Raster calculator ran smoothly on QGIS, but the resulting layer is empty.
Make sure that the input layers are in the same projection.
- Can these distance calculations be done in any projection?
No. The coordinates in the projection should be a (good) approximation of distance, in order to make this work.
- I ran the algorithm and got the following error on the Log: “The following layers were not correctly generated. [path to the file] You can check the ‘Log Messages Panel’ in QGIS main window to find more information about the execution of the algorithm.”
Scroll up to see if there any more information about this error. A common error is “Error: error in formula: [the formula you used] Error: executing tool [Grid Calculator]”. In this case, something is not right with the formula you wrote. Try a workaround.
If you cannot find the error that generated the problem, it can be a saving error. If you are using a temporary file path, try choosing a permanent one. Try choosing a shorter path, with no spaces or special characters.
- No errors, but I got the following warning: “Warning: The number of supplied grids exceeds the number of variables in formula. (3 > 2)”.
A possible cause is that you checked more rasters on the Additional Layers list than you used in the formula. When you use the position of the pixels (xpos, ypos) but do not use the original raster, this warning also appears.
Luísa Vieira Lucchese
Research Assistant Professor
Research Assistant Professor at University of Pittsburgh