Sampling raster values in predetermined points on QGIS
using a native tool and a plugin
Fellow researchers and open-source GIS enthusiasts,
Welcome to my blog!
I’d like to start with a disclaimer – I may be a researcher of this very area but that doesn’t mean everything I do or write here will work for you, in your own desktop configurations and package versions. I have no responsibility if you lose data or mess up your installation. I also do not authorize any copies of my content.
Today, I will write about sampling the values of rasters in given points. This may be useful for a range of applications, especially statistical analyses.
In this post, I show how to perform this process using two different tools, one of them is native of QGIS, and the other is a plugin available on the plugin repository. Then, I comment on how to sample the original raster using an interpolation such as cubic, cubic spline, or bilinear for the sampled value.
For the example here shown, I am using the same raster dataset I used for the talk on QGIS Open Day Brazil September/2021, available at https://github.com/luisalucchese/QGISday_092021.
It is based on an “imaginary” Digital Elevation Model (DEM), created by using dem-utils code, from ArMoraer on GitHub. All projections attributed to layers are only for example processing, but the DEM does not portrait a real part of the globe.
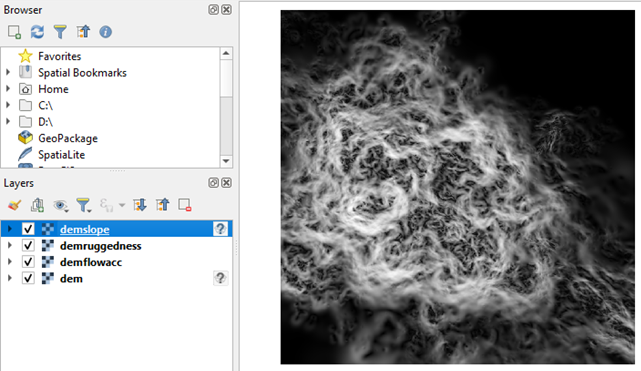
I open the rasters on QGIS 3.20 “Odense” and see this:
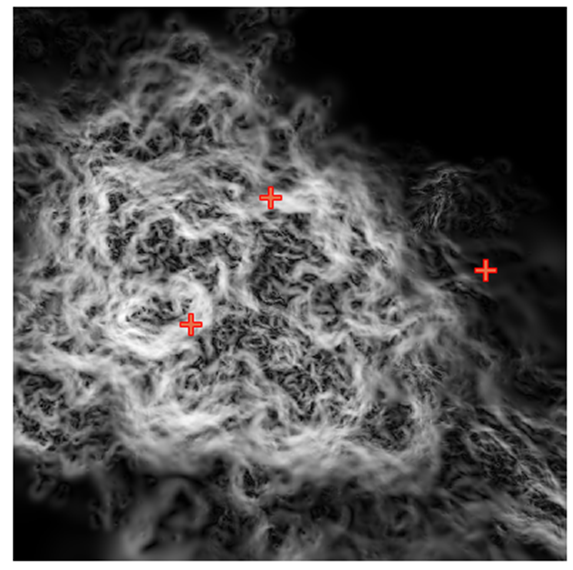
Then, just for this example, I create a point layer and add three points in it.
Now, there are two main ways to sample the raster in these points.
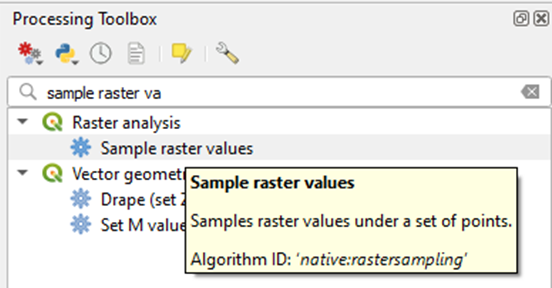
Using the native tool “Sample raster values”
Find the tool “Sample raster values” or “native:rastersampling” in your Processing Toolbox.
Using this algorithm, you should sample each raster layer individually.
I changed the Output column prefix to “DEM_” because I will have some more rasters to sample later.
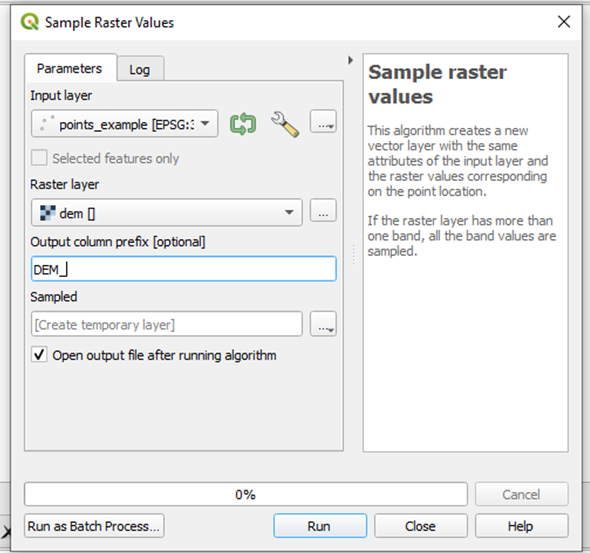
Clicking Run, it ran without issues.
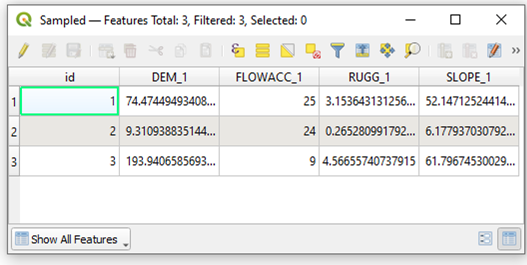
Opening the attribute table of my new vector, I find:
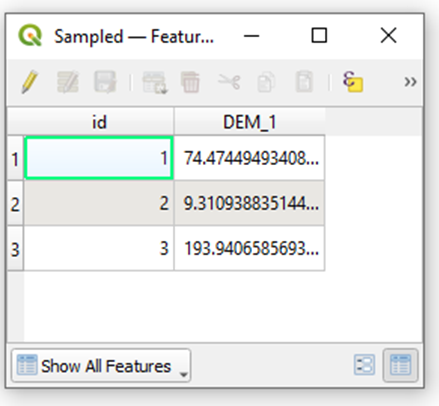
The column was given the suffix “1”, probably because it was the first and only band of the raster.
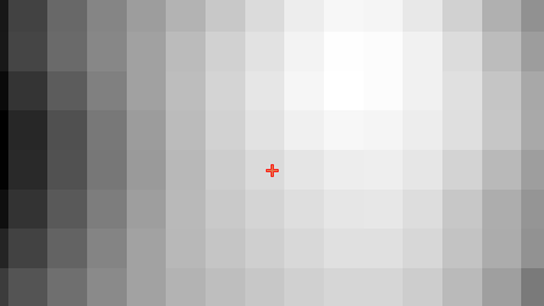
Zooming into the raster cell in which each point is located, I find the values:
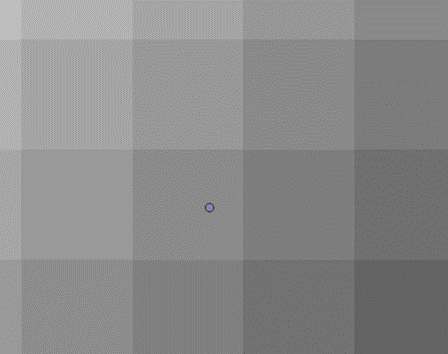
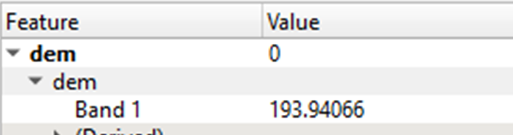
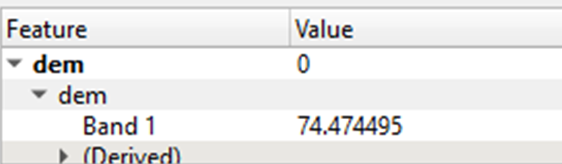
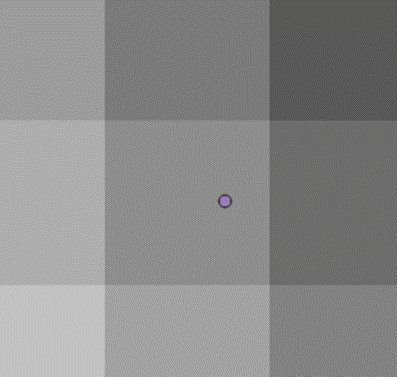
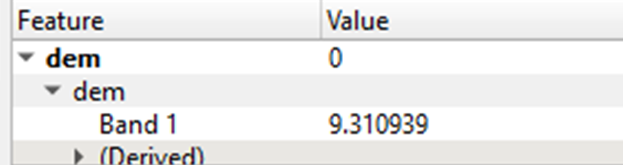
The values for the cell in which each point is contained are the same as those extracted by the algorithm. This means that the value is simply extracted from the raster, and no interpolation is performed. This is the same as saying that the tool performed a Nearest Neighbor interpolation.
To extract the values of all four rasters, run the tool three more times. In each run, select the input as the point output from the last run, but select a different raster. When the process was completed, I opened the attribute table of the resulting layer:
This process gets tedious fast if you have many raster layers from which to extract information. And in-built batch processing is not really an option, since you need the output of the last run as an input on the current one. But an option to deal with that would be to build a multiband raster from the rasters you have in separate layers and then run the algorithm.
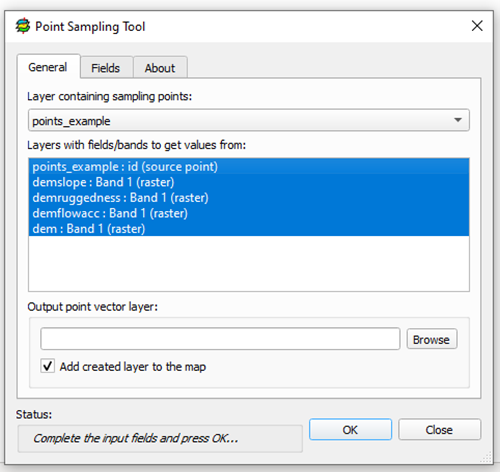
Using the plugin “Point Sampling Tool”
The plugin “Point Sampling Tool” can be found in the plugin manager of QGIS. I am using the version 0.5.3 of this plugin.
When I open the plugin, I see this:
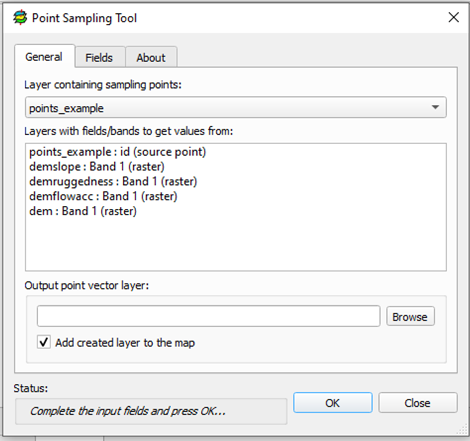
Select more than one raster by holding Ctrl while clicking the layers’ names.
In this plugin, it is not possible to save a temporary file.
I select the output path on “Browse” and click OK.
The plugin shows this warning “All layers must have the same coordinate refere system. The <layer name> layer seems to have different CRS id (0) than the point layer (32722) […]”
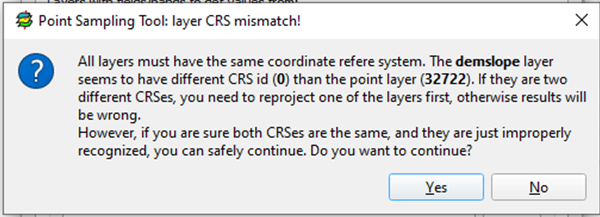
In this case, I am using DEMs created only for example purposes, and I am sure they all “descend” from the same raster, so I clicked “Yes”. However, you should analyze on a case-by-case basis. Usually, it is better to reproject either the raster or the point layer.
Opening the attribute table of the resulting raster:
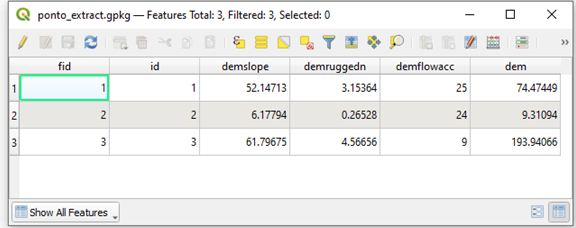
The values are the same as those acquired by the native tool, only with less significant figures.
They are also acquired with no interpolation a.k.a. Nearest Neighbor.
The names of the columns are based on the names of the layers in your QGIS project.
Extras
- Which one should I use?
Both tools work very well. In my opinion, it depends on the number of raster layers you have to extract information from. If it is only one or two rasters, I would use the native tool, but if you have more than that, I think using the plugin pays off.
- You mentioned that both point samplers use the Nearest Neighbor interpolation. How to use another type of interpolation?
Well, you can’t. But there is a workaround for that. Using “Warp (reproject)” (“gdal:warpreproject”), you can resample your raster layers to a smaller pixel size using a different type of interpolation and then run any of the sampling tools I just showed here.
Example:
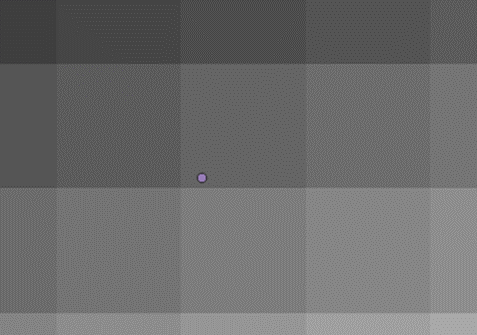
Original raster:
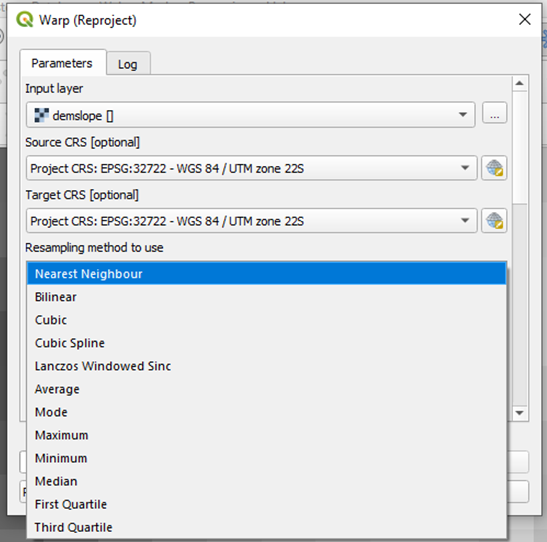
Choosing the “Cubic” interpolation and giving the output raster a smaller pixel size, this is the resulting raster:

Now, if I extract the value of this point it will be 61.9293 instead of 61.7967. In this case, in which the original pixels were not too large neither did they differ a lot in value, the difference on the extracted value is in the order of $10^{-1}$, but it can be larger depending on the case. It is better to examine the nature of your raster and analyze it to see if you should resample your raster as a pre-processing step.
Luísa Vieira Lucchese
Research Assistant Professor
Research Assistant Professor at University of Pittsburgh