A quick guide to generate continuous raster legends in QGIS 3.18 Zürich – and in QGIS 3.16.4 Hannover
Fellow researchers and QGIS enjoyers,
Hello and welcome to the first post of my site!
First of all, I’d like to start with a disclaimer – I may be a researcher of this very area but that doesn’t mean everything I do or write here will work for you, in your own desktop configurations and package versions. I have no responsibility if you lose data or mess up your installation. I also do not authorize any copies of my content.
Well, now to the matters – the legends of the figures in layout of QGIS 3.18 “Zürich”
A functionality to show continuous color ramps automatically was implemented in QGIS 3.18 “Zürich”. The QGIS 3.18.0 standalone installer was just released Windows users, in March 22th. It is now available for a range of operating systems, Windows, Ubuntu, Fedora, Debian, and others. You can check in the QGIS website (qgis.org) downloads page if QGis 3.18 is available for your operating system.
If you are using QGIS lower than 3.18 for whatever reason, skip to the section “A simple way to generate continuous gradient legends on QGIS 3.16.4 or older”.
How to generate continuous raster legends (gradient) on QGIS 3.18
- Open the Print Layout and generate the legend
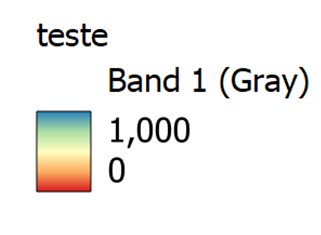
The automatic legend is already continuous. A comma is the thousands separation. If that is OK by you, you can consider the legend finished.
- Changing the format of the number
Here in Brazil and in other places, a comma may be understood as the decimal point, so removing it is advised.
To do that, on the Item Properties tab, go to Legend Items and unmark the box “Auto update”.
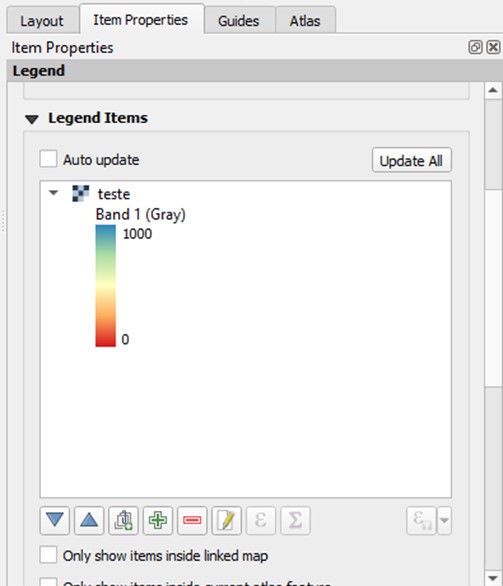
Then, click the legend and click the button “edit selected item properties”.

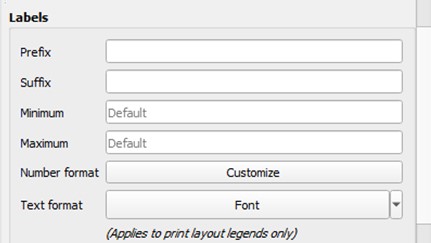
In Labels, find the button “Customize” on the right side of “Number Format”:
Uncheck the checkbox “Show thousands separator”.
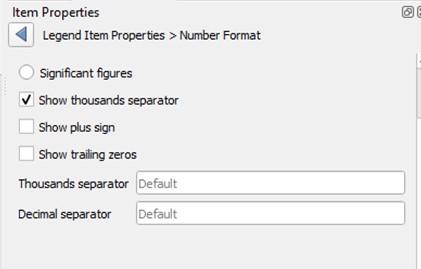
Now the thousands separator was removed:
Done!
A simple way to generate continuous gradient legends on QGIS 3.16.4 or older
- Automatic QGIS Legend
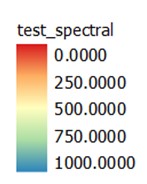
We may observe this using QGIS 3.16.4 “Hannover” or older versions like QGIS 3.4 “Madeira”. When generating the Print Layout in order to generate a figure of the raster, it is possible to add an automatic color scale to your figure. If the render type Singleband Pseudocolor was chosen to visualize the raster, this action may generate a legend with rectangles of the different colors on the ramp, or something like this:
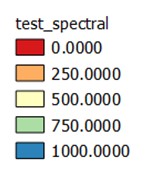
For this example raster, I chose the Spectral color ramp, from 0 to 1000, label precision 4.
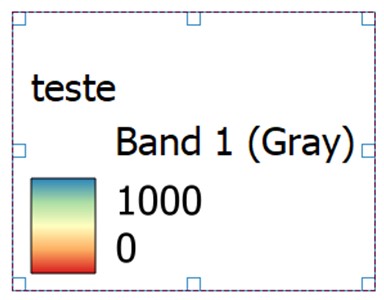
- Legend with a continuous color gradient
Now, usually I want to represent data that is not categorical, but continuous, so that I would like to see a color ramp (gradient) instead beside my map.
- Creating the legend gradient colorbar with a simple trick
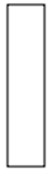
It is possible to create a rectangle in the Print Layout and fill it with the color ramp I need. On the button Add Shape (for me, it is in the left menu), I choose the option Add Rectangle and draw a rectangle. In my layout, there is something like this:
Then, I go to the Item Properties tab, on the right, and click the Style button.

Probably, the default style of the rectangle is Fill, Simple Fill. I then click on Simple Fill. In Symbol Layer Type I pick Gradient Fill.

Then, I select Color Ramp option. I click the arrow on the right of the color ramp displayed and pick the same color ramp used for the raster, in my case, Spectral. At this point, my rectangle looks like this:
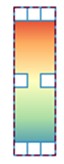
Then, I simply move the rectangle over the legend, and I get something like this:
Which is the legend representation I was looking for. Done!
Extras (for QGIS 3.16 or older):
- What if I want a horizontal colorbar?
Then, you should rotate the gradient in 90º. In Item Properties, Rotation, rotate the legend in 90 or 270º depending on your legend, and resize the rectangle accordingly.
- When I dragged the rectangle, it went under, and not over, the legend.
Go to the Items tab, where it shows the layers of your print layout and reorder them, placing the rectangle on top of the legend.
- I altered the color scale of the Singleband Pseudocolor representation and now none of the default gradients match mine. What should I do?
There is a way to put your custom color scale in the rectangle. You will need to save your color scale preset to QGIS. First, in the QGIS main window, right click the raster layer and open the Properties window. Click Symbology on the menu. Besides Color Ramp, click the small arrow on the right side of the gradient. Save the color ramp. It should now be available in All Color Ramps. Go back to the Print Layout window. Select the rectangle. On the Item Properties of your raster layer, do the same procedure as you would for a default color ramp but select your custom color ramp.
Luísa Vieira Lucchese
Research Assistant Professor
Research Assistant Professor at University of Pittsburgh