How to use QGIS 3.20+ to generate outstanding river and drainage net map representations
Fellow researchers and open-source GIS enthusiasts,
Welcome to my blog!
I’d like to start with a disclaimer – I may be a researcher of this very area but that doesn’t mean everything I do or write here will work for you, in your own desktop configurations and package versions. I have no responsibility if you lose data or mess up your installation. I also do not authorize any copies of my content.
Symbology for lines in QGIS has gone through so much improvement in the last version 3.20 “Odense”. As time passes, I find more ways to enjoy these new possibilities.
The first thing I thought when I saw the “Interpolated Line” symbology (I described this functionality in this post) was that it would be useful to represent drainage networks.
Today, that is what we are exploring. Innovative ways to represent your river network to depict the watershed in an even more elegant and informative way, using the “Interpolated Line” functionality.
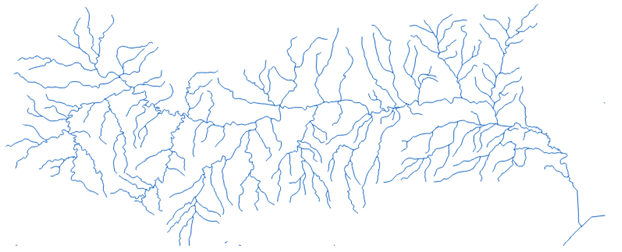
I will demonstrate this on the shapefile of the basin of Rio Camaquã, in Brazil. I have the vector file for the local drainage net, extracted from the drainage nets provided by IBGE.
I will use QGIS 3.20 “Odense” for this tutorial. You will need either this or a later version of QGIS (which currently does not exist, QGIS 3.22 release is pre-scheduled for 22/10/2021).
1) Adjust the direction of the lines that compose the drainage net
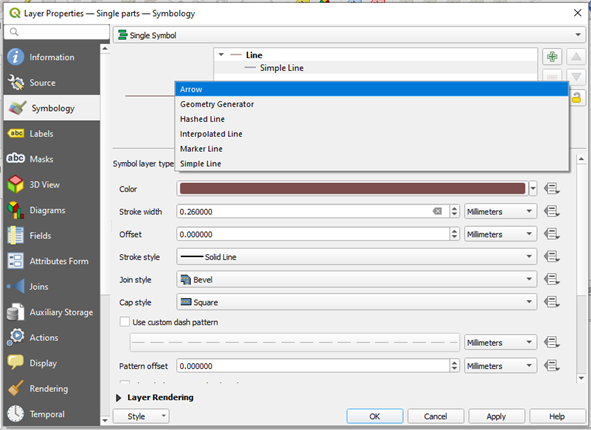
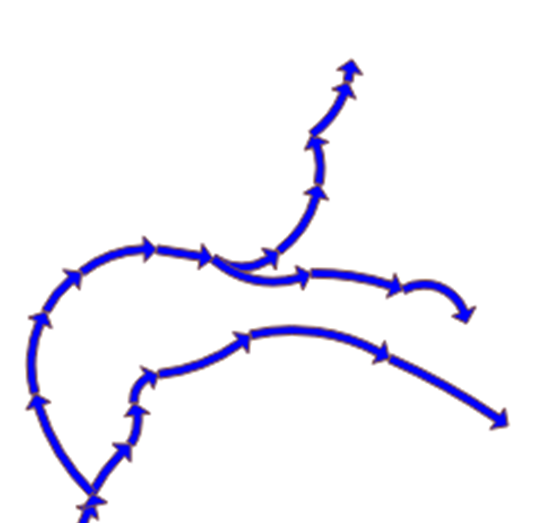
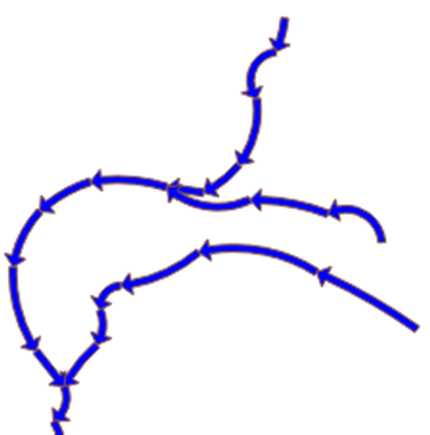
To know the direction of the lines in a vector file, change its symbology from “Simple Line” to “Arrow”.
Zooming in the drainage net, you can see where each line “points to”. In order for the stream order analysis to work, the lines should point in the direction of the flow.
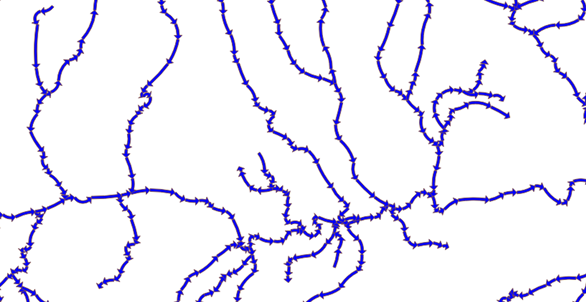
So, any of the segments that are pointing in the wrong direction should be reversed.
In this part, all segments are pointing in the wrong direction. We should reverse them.
First, Toggle Editing. Then, in the Advanced Digitizing panel (if you don’t see this panel, turn it on on the “View” menu), click in “Reverse Line”
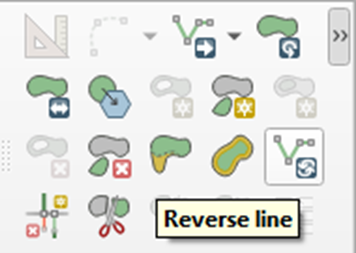
Click the segments to invert them.
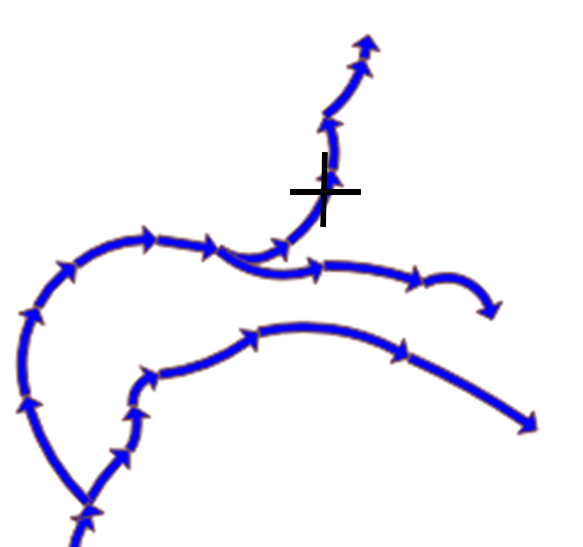
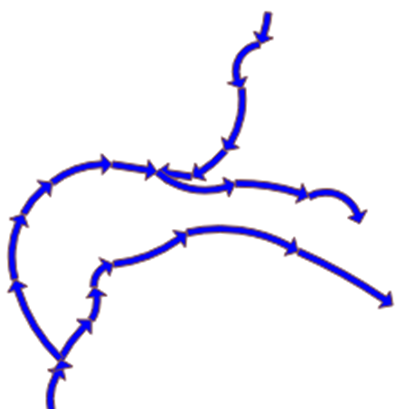
Do the same for the whole vector and then save your edits, and “Toggle Editing”.
When every line points in the way that the stream flows and you have saved the file, you can move to the next step. But if you miss any of the streams, don’t worry, you’ll have the chance to adjust it later.
2) Calculate River stream order
This will be useful to adjust the symbology later.
I found that the easiest way to calculate the stream order of the drainage net is to use the plugin Hy2roresO. It is not available in the Plugin Manager of QGIS, so it needs to be downloaded separately. In Windows environments, download the ZIP file and place the exctracted folder in “python/plugins/” on your QGIS installation folder. See more detailed instructions here.
After downloading Hy2roresO, you need to activate it on the Plugin Manager. In the menu of QGIS, click “Plugins”, then “Manage and Install Plugins”. Select “Installed” in the side bar and check the Hy2roresO checkbox. The icon of Hy2roresO should appear in your screen:
Before you click it, check the type of your input vector. It should be “Line” or “LineString”. If it is “MultiLineString”, use the tool “Multipart to Singleparts” to break the lines apart. If you are working with an ESRI Shapefile (.shp) you might want to save it in Geopackage format. Toggle Editing before running the algorithm.
Click the icon.
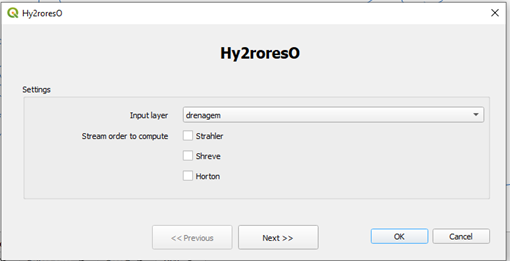
Choose the input layer and the types of stream order you will want to compute. Currently available are Strahler, Horton, and Shreve. In my opinion, Shreve stream order calculation works best for what we aim to represent, because it will make the resulting lines thicker on the confluence of two large tributaries. However, Strahler order is useful for spotting potentially wrong line orientations.
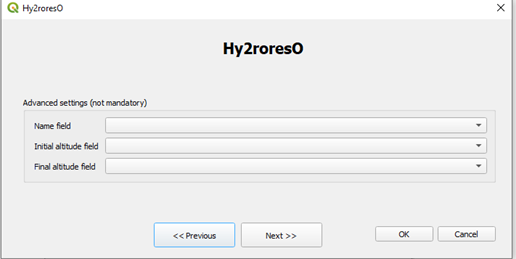
Click “Next”. I did not fill anything on this screen, but if you have this information and wish to fill it, do it at your will.
Click “Next”. I didn’t save the output layer, because this plugin creates extra columns in the Attribute Table of your input layer itself, which I found more useful. It is best to have a safe backup of the input layer anyway.
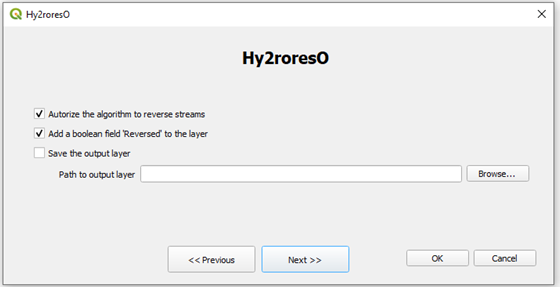
If you Click “Next”, there is information about the plugin. To run the stream order analysis, you need to click “OK”.
A dialog like this one might appear:
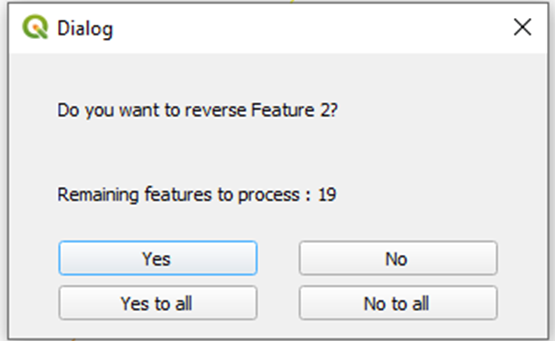
Because you already tailored your lines for this analysis, there are probably no features to reverse. Click “No to all”. When it finishes, you should see this dialog:
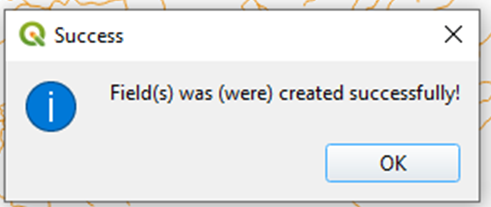
Click OK.
3) Alter the symbology of the vector layer to test the results
Open the Properties and click “Symbology” on the left menu. Click in “Simple Symbol” and change it to “Graduated”. In the “Value” field, find one of the stream orders calculated. Click “Classify”, and then “Apply”.
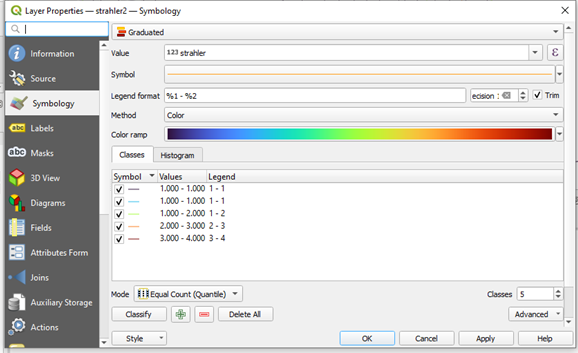
Check the layer representation:
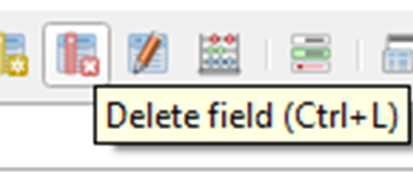
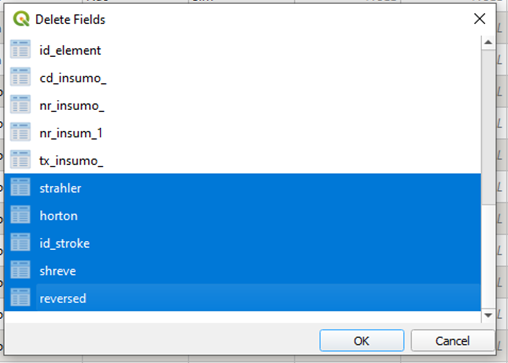
Analyzing this image, I see that the top right part of the basin still has some lines to be reversed. Change the symbology to the arrow type and reverse the lines that still need to be reversed. Before running Hy2roresO again, you should delete the columns generated in the last analysis. Enter the Attribute Table, Toggle Editing and click “Delete Field”. Select the fields “Strahler”, “Horton”, “id_stroke”, “shreve”, and “reversed” for deletion. Save your edits.
Run the plugin again and check the stream orders. Adjust as necessary. Redo this process as many times as needed.
4) Use Interpolated Line symbology to represent the lines
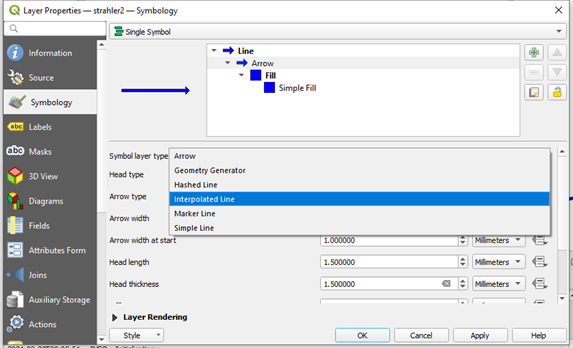
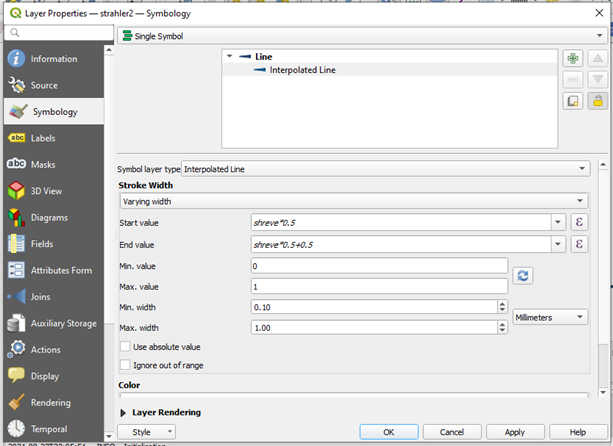
In the symbology, pick “Interpolated Line”.
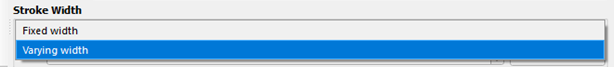
In “Stroke Width” choose “Varying width”:
I will choose Shreve stream order for my representation, because it sums the order of two tributaries to calculate the order of the stream, which I believe will provide a better visual effect, but you can choose whatever you think suits your map best.
The main rule for this representation is that the start value should be smaller than the end value for the thickness of the line, and that they should depend on one of the stream orders calculated. Play with minimum and maximum values, as they can fundamentally alter the representation. Then, choose a single color or apply a rule for the line colors as well.
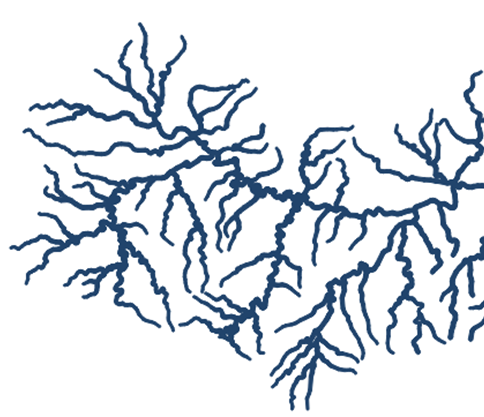
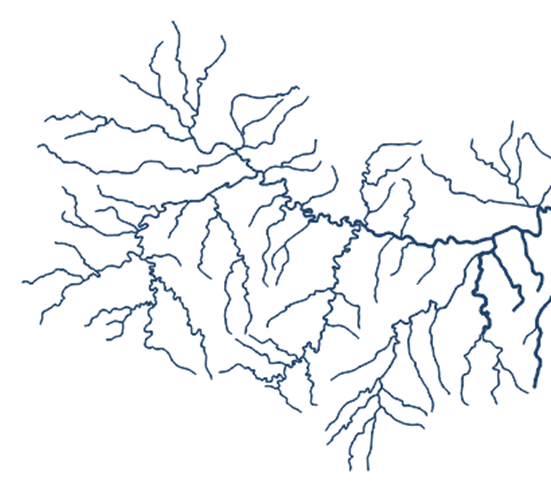
Max value = 1 generates:
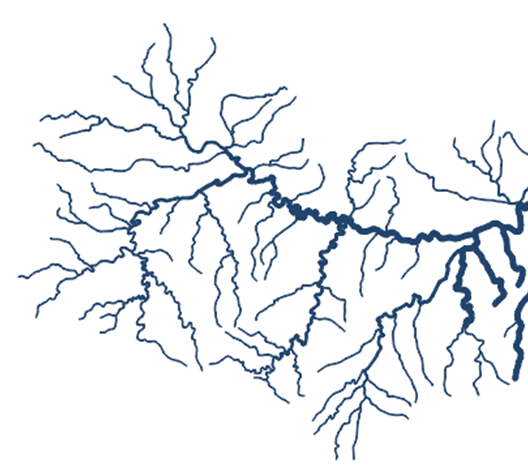
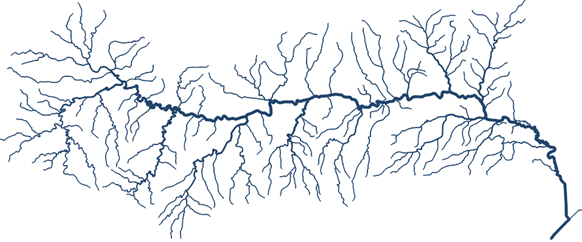
Max value = 10 generates:
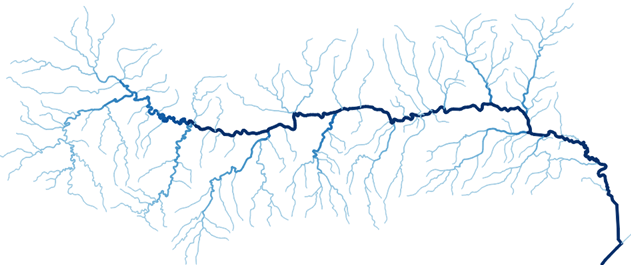
Max value = 50 generates:
Which to choose depends on your objective, other elements in the map, etc.
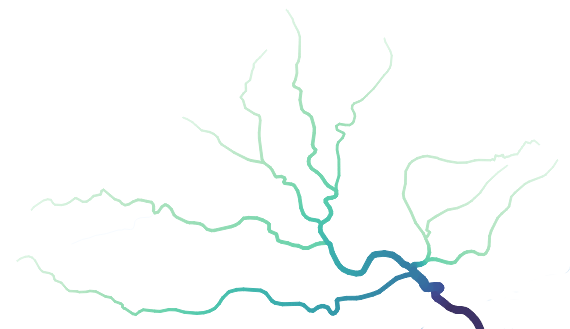
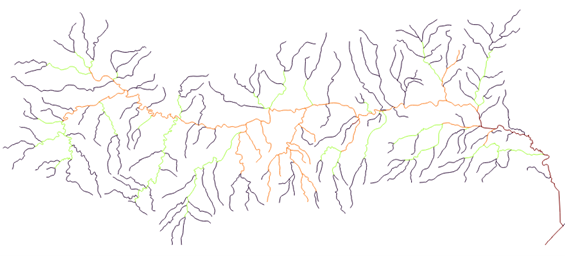
My basin drainage net currently looks like this:
Adding interpolated line color as well, it looks like this:
That looks nice over the other layers of my map:
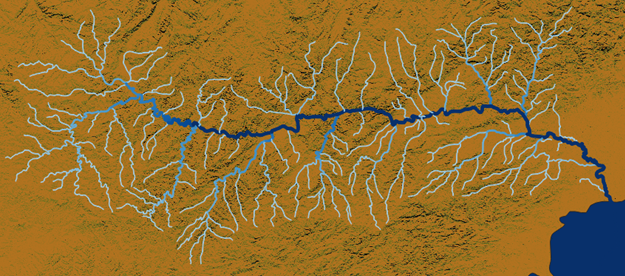
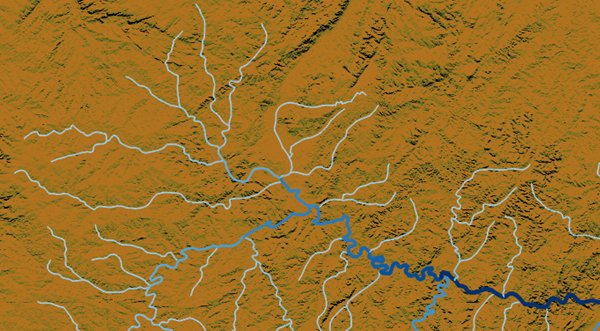
Sources: TOPODATA from INPE, IBGE, Natural Earth.
You can play with the colors however you like to. This is another version of my map, with a custom color ramp:
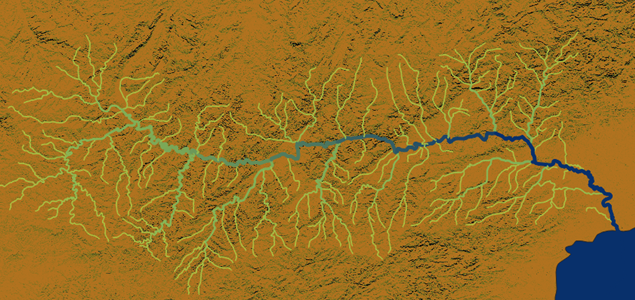
Sources: TOPODATA from INPE, IBGE, Natural Earth.
Extras
- How did you match the color of the Camaquã river and the color of Patos Lagoon, on the right side of the visualization?
I changed the symbology of the Patos Lagoon, by picking the color of its fill on the screen.
- What if I want to adjust the symbology of each stream individually?
You can definitely do that. In the symbology, instead of “Single Symbol”, pick “Categorized” and fill the Value as the “fid”. This way, every line will in your river network can have a different symbol. Double-click each one and change accordingly. This way, you can match the colors of the streams perfectly. You do not need to change the color ramp, just the Start Value and the End Value within the same range, for the line to get the right part of your gradient ramp. An example of how it can look like:

Luísa Vieira Lucchese
Research Assistant Professor
Research Assistant Professor at University of Pittsburgh