Testing some of my favorite changes in QGIS 3.20 Odense
Fellow researchers and open-source GIS enthusiasts,
Welcome to my blog!
I’d like to start with a disclaimer – I may be a researcher of this very area but that doesn’t mean everything I do or write here will work for you, in your own desktop configurations and package versions. I have no responsibility if you lose data or mess up your installation. I also do not authorize any copies of my content.
Today QGIS 3.20 “Odense” was released!
In today’s post, I will test some of my favorite features of the new version.
To check all the new features and the bugs fixed, check the full Changelog of QGIS 3.20.
Opening an attribute table with just the selected features
Especially useful when dealing with shapefiles with multiple polygons, lines, or points.
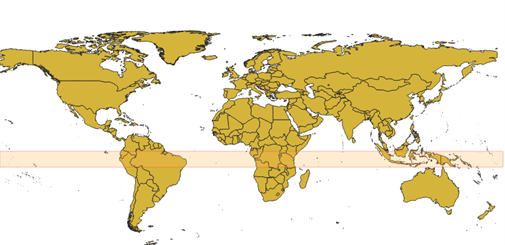
I am testing this in a shapefile with the countries of the world.
Select the features
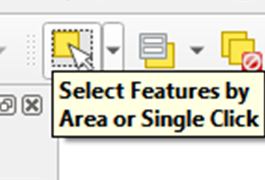
I will select all countries that are on these latitudes.
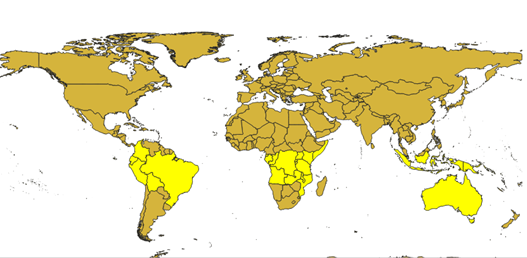
Resulting on this selection.
Open the atribute table
Click in Open Attribute Table (Selected Features)
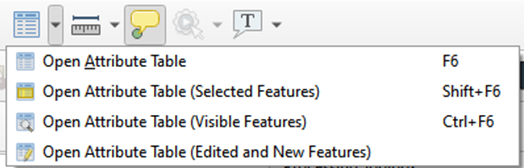
Which opens an attribute table with just the selected countries:
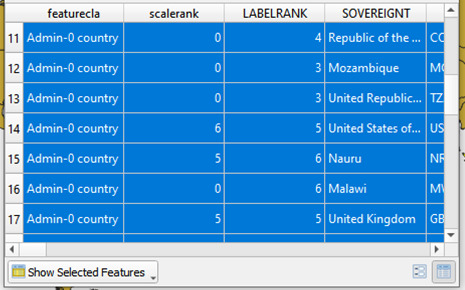
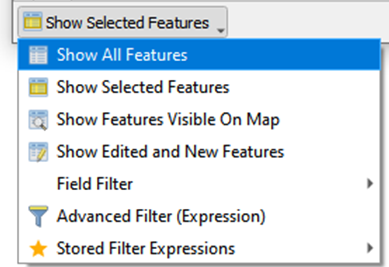
If you want to see all features, just click the button “Show Selected Features” and click “Show All Features”.
Stream digitizing
QGIS now supports freehand drawing of lines and polygons.
In the advanced digitizing toolbar, select “Stream Digitizing”:
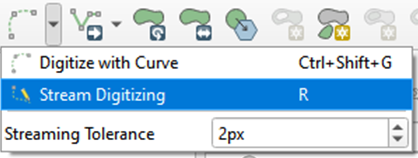
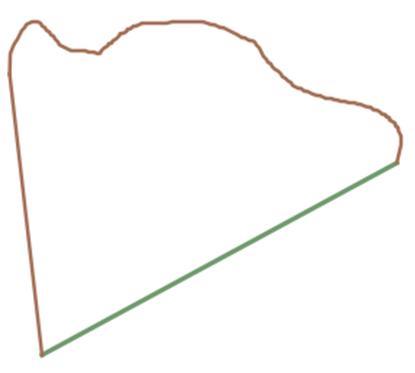
After clicking the first point, just move your mouse pointer around the screen to draw the line or polygon.
Snapping to endpoints
Like in Computer Aided Design (CAD) applications, now in QGIS you can snap to the endpoints of lines when drawing.
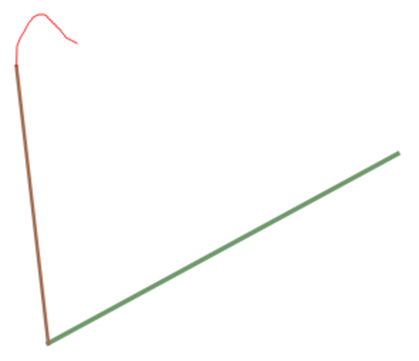
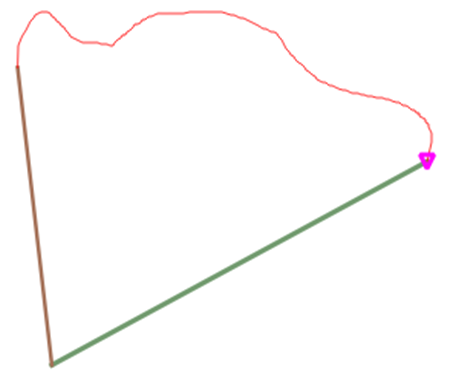
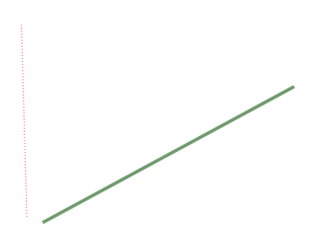
First, I draw one line (in green). Then, I start drawing another line.
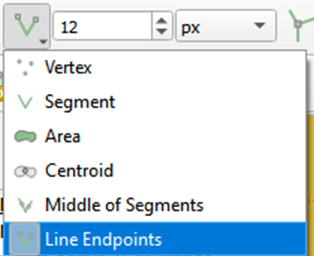
Make sure that the Snapping Toolbar is activated in View, Toolbars, Snapping Toolbar. In the snapping toolbar, select the option “Line Endpoints”.
After selecting this option, when your cursor is close to a line endpoint, it should show a special marker.
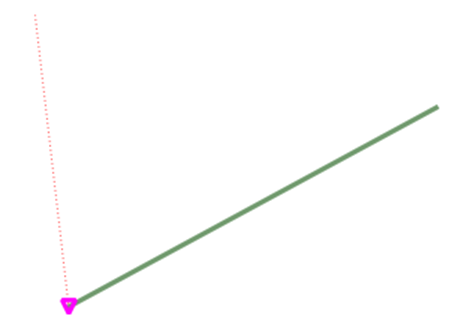
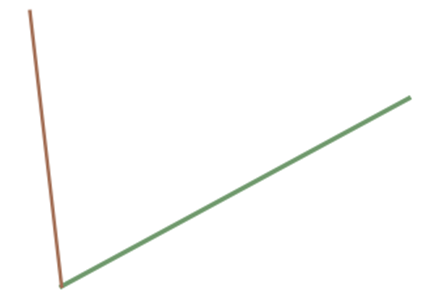
Just click and the line is drawn.
Variable thickness of lines and painting them with a gradient
This feature is listed in QGIS 3.20 Changelog. Unfortunately, I could not make this work in QGIS 3.20.0 Odense.
I will update this post in case I manage to make it work.
Updated! June 22th, 2021
This looks especially useful for hydrology representation. Configure the streams to have thinner lines at one extremity and thicker at the other.
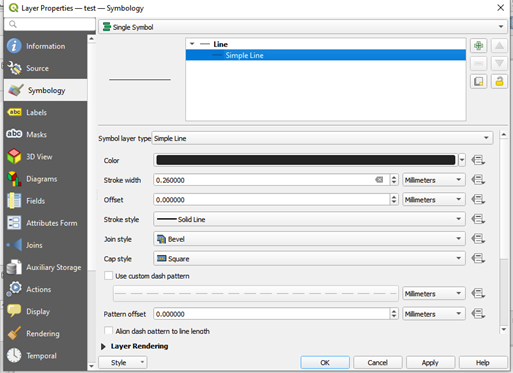
First, open the symbology panel
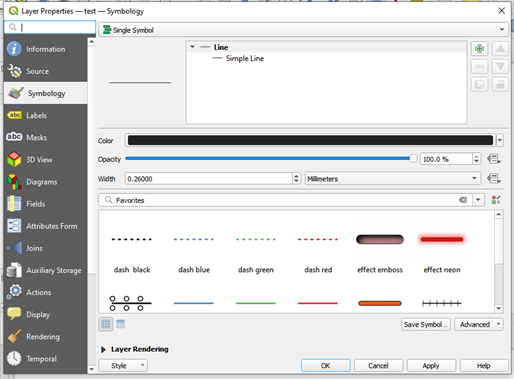
Click in Simple Line
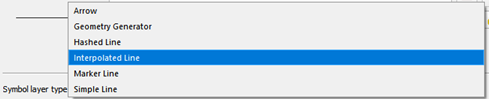
Choose the type of symbol as Interpolated Line
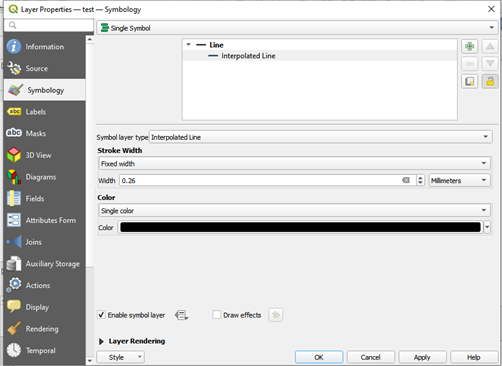
This panel should open:
Troque o tipo de largura da linha
Switch from Fixed width to Varying width. This should appear:
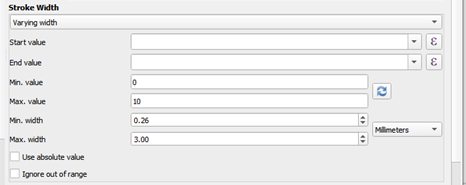
If you click the selector on the right side of Start value, QGIS will offer you the option “id”. Do not click!

Actually, populate this field with a number. It should be a different number from the one you write on “End value”. If you write the same number the linewidth will not vary.
Write 0.1 in Start Value and 10 in End Value. Click in Apply.
Done! Variable width.
Up next, gradient color
On the dropdown menu, switch from Single color to Varying color. This panel should be opened:
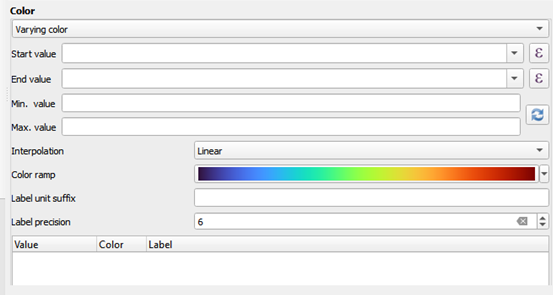
Once more, do not select “id” as Start or End value. Type numbers instead.
I typed 0.1 as Start Value and 10 as End Value. I then clicked in Apply.
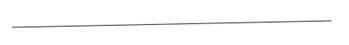
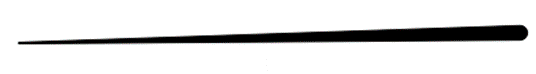
At this point, the line looks like this:

However, we can change the color gradient, in “Color ramp”. I chose the one named “Blues” because tones of blue should suit hydrology applications well.

Done!
These are my favorites so far!
If you work with vector labels, many new features on this matter were implemented and I suggest you take a look on the full log.
Is it worth to install QGIS 3.20 if QGIS 3.22 LTS is scheduled to be out in October?
I haven’t had serious bugs on QGIS 3.18 and it has the implementation of continuous raster legends, which I use all the time. I cannot imagine waiting until October to have continuous raster legends in Print Layout, when this feature already exists. I have been installing non-LTS versions of QGIS for over a year so far with little crashes. That said, people have different experiences, and installing a non-LTS version is considered risky by some.
Luísa Vieira Lucchese
Research Assistant Professor
Research Assistant Professor at University of Pittsburgh